Daily insights for city builders, delivered every morning at 6 AM ET. I’m Brandon Donnelly — a Toronto-based real estate developer and founder of Globizen. I’ve been writing here since 2013.

Tag: cape town

  • Die Es

    image

    To celebrate the launch of their Guide to Cosy Homes (2015), Monocle Films produced a number of home tours. 

    Die Es, pictured above, is the home of South African architects Gawie and Gwen Fagan. They started building their home in 1964, just as they were starting their practice. 

    Because of this, they had little money and had to do a lot of the work themselves. They sold their car to buy a concrete mixer.

    Although they didn’t set out to explicitly design a “Cape” house, it ended up that way, with heavy thermal masses, white walls, and so on. 

    The architecture also relates very closely to the surrounding landscape – as it should – in the way in which it frames views of the water and mountains. 

    The mediterranean climate also really comes through in the materiality of the home and the connections to outside.

    If you’d like to watch the 5 minute tour of Die Es, click here.

  • Snowboarding, vlogs, Cape Town, and marketing

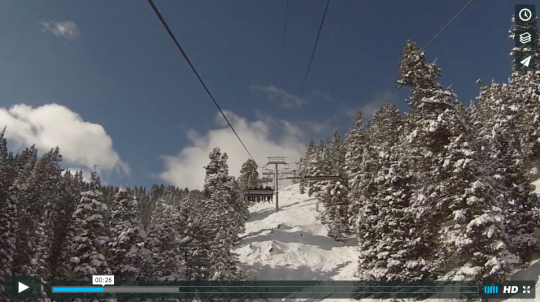
    This morning, instead of my usual routine of writing alongside a cup of coffee, I decided to finally edit all of the skiing and snowboarding footage that I took last month in Park City, Utah. Click here for the final cut.

    Compared to the video we did for Jackson Hole, I don’t like the selfie perspective as much. It doesn’t show enough of the person. This time we used the Go Pro 3-way arm, but in Jackson we used a plastic tube that I think was used for a beer funnel before that. Next year we’ll go back to that.

    Video is a lot of fun and I would love to figure out a way to incorporate more of it into this blog. But that’s a far bigger time commitment and I am not prepared to allocate resources to that. I write every day. That’s my thing.

    I am, however, not ignorant to what’s happening in the world of video blogging. And I think there are lots of opportunities for businesses who have the resources to allocate towards projects like this.

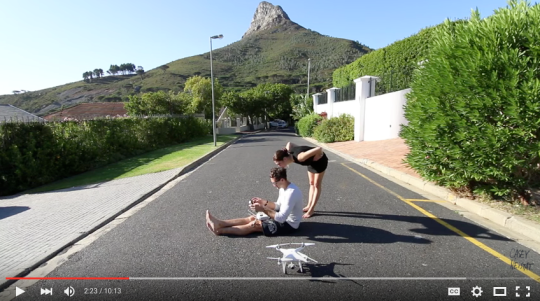
    Take for instance this vlog by New York video guy Casey Neistat. It’s probably the best piece of marketing that the Phantom 4 drone could have asked for. It’s authentic. I watched it and now I want one. Take my money. 

    (Note to city geeks: It’s worth watching just for the drone aerials of Cape Town, South Africa.)

    To my knowledge, I don’t think people are doing anything like this in the real estate business. But eventually it will happen. Because people are becoming increasingly immune to your typical marketing pieces.

  • The global pyramid of wealth

    Every year the London-based property consultancy Knight Frank publishes something called The Wealth Report. And it’s one of those reports that I could go through for hours. 

    It includes a ton of really fascinating stats that speak volumes about where in the world wealth is being created and how it’s moving around. And of course there are a lot of connections between wealth, real estate, and city building.

    Below are 3 diagrams that really stood out for me in the 2015 version. 

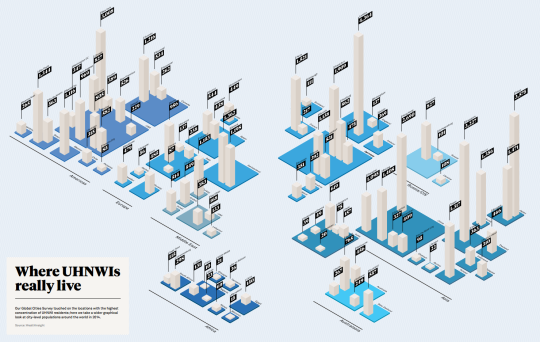
    The first diagram shows which cities have the most Ultra High Net Worth Individuals (UHNWIs). An UHNWI is defined as an individual with assets exceeding US$30 million, but excluding personal assets and property (such as one’s principal residence). Click here to see the full size image (I know the numbers are small).
    image

    Not surprisingly, London (4,364), Tokyo (3,575), Singapore (3,227), New York (3,008), and Hong Kong (2,690) are at the top of the list. But I was a little surprised – albeit happily surprised – to see Toronto (1,216) come in at #2 in North America, beating out Mexico City (1,116), Los Angeles (969), and Chicago (827). 

    The second diagram shows you how many square meters of luxury property (apartment) you can buy for US$1 million in a bunch of different cities around the world. 

    In Monaco (top end), that’ll buy you 17 square meters (183 square feet) and in Cape Town (bottom end), that’ll buy you 208 square meters (2,196 square feet).

    image

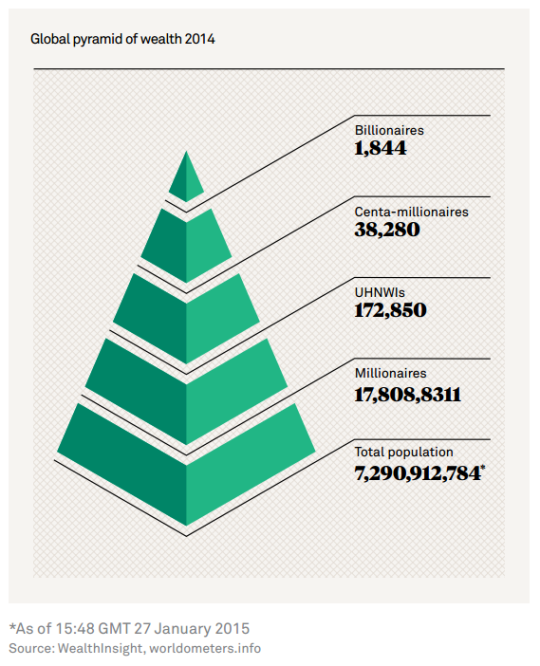
    The third and last diagram is what they call the global pyramid of wealth. It’s a pyramid of everyone in the world and then the number of millionaires, UHNWIs (see above), centa-millionaires, and billionaires. And if you do the math, the top of this pyramid comes nowhere close to 1% of the global population.
    image

    It’s fascinating (and exciting) to see where and how global wealth is concentrating. But it should also make you think about rising income inequality. I know it does for me.