
Daily insights for city builders, delivered every morning at 6 AM ET. I’m Brandon Donnelly — a Toronto-based real estate developer and founder of Globizen. I’ve been writing here since 2013.

Tag: bloomberg green

  • EV charging stations > gas stations

    If you do a search for the number of electric vehicle charging stations in the US, you’ll likely get a number somewhere around 160,000. But to better understand what this means, you’ll probably want to ask a few follow-up questions:

    • Are these individual charging ports (for a single vehicle) or are these stations (locations with multiple charging ports)?
    • How many of these chargers are private versus publicly-accessible?
    • And how many of these are DC fast, versus just level 2? Level 2 is what most people have at home (I think), whereas DC charging is what you need if you’re stopping on the side of the road and need to supercharge your car in 20-30 minutes.

    Usually the biggest fear with EVs is range anxiety. We have come to expect that we’ll be able to find a gas station when we need it, but, for the most part, we don’t yet feel that way about EV charging stations.

    So for this concern, the more precise question would be: How many publicly-accessible DC-fast charging stations are there in the US? This is the filter that gives you stations that would be most comparable to how gas stations function today.

    The answer, according to the US Department of Energy, is about 10,597 stations and 44,160 charging ports. And according to Bloomberg Green, this puts the US on track to have public fast-charging sites outnumber gas stations in about 8 years.

    Of course, it’s probably safe to assume that the pace of EV adoption will only increase. And that means that this flip could happen well before 8 years. In my mind, that’s soon.
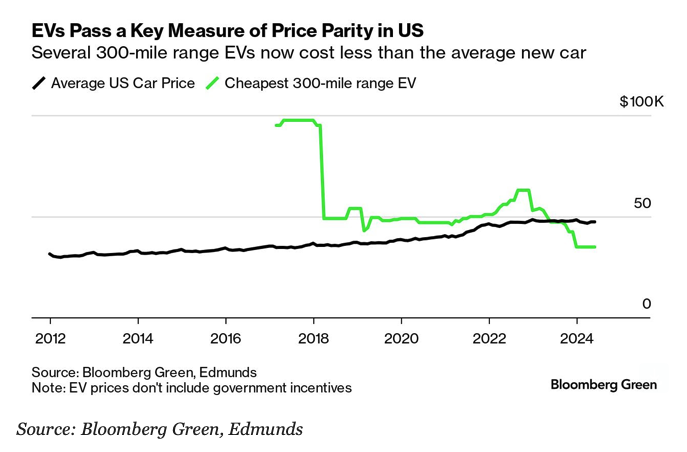
  • Electric vehicles are approaching price parity

    According to Bloomberg Green, there are now at least three car manufacturers — Tesla, Hyundai-Kia, and GM — with electric vehicles that (1) have a range greater than 300 miles (480 kilometers) and (2) cost less than the average price of a new vehicle in the US (which is currently around $47,000). This means that we are now approaching price parity:

    This is an important adoption milestone, even if it does, at this point, feel totally expected. The International Energy Agency (IEA) is forecasting full price parity by 2030. But in my mind, I’m already done with ICE vehicles. When I bought my current car over 6 years ago, I knew it would be the last internal combustion engine I ever own.

  • Comparing innovative technologies

    This is an interesting chart from Bloomberg Green comparing some of today’s innovations against innovations of the past. At the top of today’s innovations are EV batteries, which from 2010-2020, saw annual deployment growth similar to that of US WWII aircrafts. However, when it comes to reducing costs, both EV batteries and solar PV modules come out on top with annual declines approaching almost 20%.

    Of course, these probably aren’t perfect comparisons. If you look at EV batteries and solar PV modules from 2020 to 2023, their growth rates jump to 72% and 39%, respectively. So who knows if these are the right time slices to be using in order to accurately capture the “key expansion periods.” Regardless, it does provide some historical context and it does say something. These are important innovations.

  • Renewable power now accounts for about 13% of global electricity generation

    This is an interesting chart from Nathaniel Bullard over at Bloomberg Green. In 1985 (the start of this chart), coal-fired power was responsible for about 38% of global electricity generation. This particular stat hasn’t changed all that much since then — the current figure is around 36% — but renewables have gone from 0.8% to 13% of global electricity. That is something. Since 2010, renewables are adding about 0.8% market share each year, and presumably this rate will only increase going forward. (Here, renewable power is defined as wind, solar, geothermal, biomass, and small hydropower.)

    Chart: Bloomberg Green

  • Electric vs. internal combustion engine

    Porsche released its first electric car back in 2019. It was the 2020 Porsche Taycan, which was fairly similar to the Porsche Panamera sedan in terms of price, performance, and styling, except that it was fully electric. So if you were in the market for a very expensive sedan, it was more about whether or not you wanted an electric vehicle or a vehicle with an internal combustion engine (ICE).

    In the quarter in which it launched (Q4 2019), the Taycan ended up only representing about 7% of Porsche North America’s overall sedan sales. But by the second quarter of the following year it was nearly 50%. And in the first quarter of this year (2021), it was over 80% of their sedan sales. That was fast. Pretty soon, I would imagine there will be no point in even making the Panamera.

    Now, the Panamera and Taycan aren’t exactly mainstream vehicles. But I found the above chart (which is from Bloomberg Green) interesting in that it feels like an all-things-being-equal kind of question. If you happen to be in the market for a six-figure Porsche sedan — and all things are kind of equal — would you rather an electric model or one that runs on gas? Already most people are choosing the former.

  • Thoughts on electric vehicle adoption

    Nathaniel Bullard’s latest Sparklines article for Bloomberg Green makes some interesting arguments around EV adoption.

    First, he shows that cars in general have been getting a lot more expensive. Looking at new vehicle market share in the US according to price (above), you can see how quickly cars over $40k have become about half of the market. Only some of this is inflation.

    Nathaniel then goes on to show just how many people lease a luxury vehicle (apparently this is called lease penetration). For Infiniti it’s 55.6%, for BMW it’s 49%, and for Mercedes it’s about 40%.

    When you consider that “upfront cost parity” between EV and internal combustion vehicles is supposed to arrive sometime in 2024, there is an argument to be made that people are destined to start buying a lot more EVs in the near future.

    They’re already buying expensive cars and EVs will soon be cost neutral in that regard. At the same time, a lot of people lease their cars and will be in a position to easily switch when it makes sense to do that.

    I think the greater barrier to adoption at this point will be the charging network and “range anxiety.” Too many plug types and not enough charging stations, except maybe if you have a Tesla. But at some point that too will change, I’m sure.

  • Off the grid

    Two things struck me today.

    First, I read Bloomberg Green’s daily newsletter (Nathaniel Bullard) and came across the following statistic. In 2001, the world installed 290 megawatts of solar generating capacity. This year, the world is likely to install more than 100 gigawatts of solar — that’s 350x more per year than we were installing 19 years ago. You can also see how things have changed by looking at the above chart showing wind and solar asset financing per year.

    Second, I read about Fred Wilson’s SunPower Solar system and how, since May, he has been able to satisfy 91.5% of his home’s electrical needs via solar (this includes an electric vehicle). In fact, during the month of May when temperatures were a bit cooler, he had a surplus. He was producing more than he was consuming, and so he was selling that excess production back into the grid. It wasn’t until the summer months and higher AC usage that he started having a shortfall.

    Now I don’t know where his house is located or what its roof looks like, but it is interesting to consider both the macro and micro scale. 91.5% signals to me that it shouldn’t be much longer before many people and many homes no longer need to draw any power from the grid. That’s going to be a game changer.

    Chart: Bloomberg Green

  • Peak meat

    There is evidence to suggest, according to this recent Bloomberg Green article as well as many other sources, that we may be hitting “peak meat.” That is, the global production of animal proteins appears to be declining. It declined last year in 2019 and that was only the second time since 1961 in which that happened. And this year, the same is projected to happen, which is supposedly unprecedented in modern times.

    The big change is that people are eating a lot less beef. In fact, per capita beef production peaked way back in the 1970s and has been slowing declining ever since. The growth over the years has really been coming from chicken. In 1961, 39% of all meat production was beef. As of 2018, that number had declined to 20%. Pork as a percentage of all production has remained more or less consistent. But chicken has basically tripled from 11% to 34%.

    From an environmental and climate change standpoint, this is a very good thing. As most of you know, greenhouse gas emissions from the production of beef are vastly higher (about 10x) than for pork and chicken. Chicken is the lowest (see above). At the same time, big bets are being made that this growing love of chicken isn’t enough. In the first 7 months of 2020, over $1.4 billion of venture capital was raised for “faux meat” startups (source). This is already a significant increase compared to 2019.

    This money is expecting the future of meat to be plant-based and cell-based.

    All charts from Bloomberg Green.