Daily insights for city builders, delivered every morning at 6 AM ET. I’m Brandon Donnelly — a Toronto-based real estate developer and founder of Globizen. I’ve been writing here since 2013.

Tag: austin

  • Crossing the chasm in Austin

    I can’t open Twitter these days without seeing someone in the tech industry talking about moving or talking about someone who just moved to either Austin or Miami. “What’s the best neighborhood in Miami for startups? My friend just moved to Edgewater. Where did so-and-so move?”

    Here’s a recent article from the WSJ talking about how accelerated tech-fueled growth is straining Austin. And below is a set of charts (from the article) comparing home prices in Austin and San Francisco. (Reminder, the California-to-Texas migratory pattern recorded the highest number of “net movers” last year.)

    But in reading through the article, I am reminded that the challenges facing Austin are not entirely unique. Growing cities all around the world are being put in a position where they need to decide whether they want to remain car-oriented and relatively low-density, or if they want to make the shift toward more transit-oriented urbanism.

    It’s admittedly not easy, both politically and practically speaking. It’s hard to rewrite deeply entrenched built form. But Austin is naturally looking at what happened in San Francisco, where restrictions on new development are thought to be partially (largely?) responsible for the city’s unaffordable housing.

    According to the same WSJ article, voters in Austin turned down two previous transit proposals. One was in 2000 and the other was in 2014. There was concern over too much urbanization. There was concern it would induce more people to move to the city. And there was concern that it would threaten the city’s low-rise single-family homes.

    But this year a transit plan was approved that includes three new rail lines, one of which will tunnel through downtown. Provided that Austin can effectively pair this with more housing, more uses, and more density — which is generally what you need to make transit work — then it may be well on its way to crossing, if you will, the chasm of urbanity.

    Charts: WSJ

  • Where people are moving in the US

    Another day, another set of announcements about large companies and rich people moving to lower cost US states. Yesterday it was announced that Oracle will move its corporate headquarters from Silicon Valley to Austin, Texas. (If you remember, Elon Musk also recently announced that he had moved himself to Austin from California.) The company has said that the move puts Oracle in the best position to grow and to give its employees greater flexibility about where and how they work.

    While these sorts of moves are making headlines right now, it’s important to keep in mind that this is not necessarily a new phenomenon. In fact, depending on how you look at it, you could argue that these headlines are a lagging indicator for trends that have been underway for some time. Below is a chart from New Geography showing the top 50 state-to-state moves last year. Number one is the move from California to Texas with 45,172 net movers. And number two is the move from New York to Florida with 38,512 net movers.

    According to New Geography, California saw a net domestic migration loss of 912,000 people from 2010 to 2019. And the most popular receiving states are what you would expect: Florida (1,230,000 people) and Texas (1,146,000 people). A big part of this story obviously has to do with housing affordability and the search for an overall lower cost of living. As well, since companies are always in need of young and smart talent, it makes since for them to locate in places where young and smart people want to live.

    But urbanists like Richard Florida have also pointed out at this relocation of companies could be a leading indicator for something else: the decline of innovation in America. Here, he argues that in the nascent stages of a new invention, there tends to be a tight clustering phenomenon. Think steel in Pittsburgh, cars in Detroit, and computing in Silicon Valley. However, as the industry matures, the tendency to centralize seems to decline and companies then start moving around.

    I’m not yet convinced that this is what’s happening. Because there seems to be a pile on happening in specific cities like Austin (which, by the way, I hear is terrific). Even before this pandemic, there was a growing sense (from the outside, mind you) that the Bay Area had simply gotten too expensive, both for individuals and for companies. It would seem that when you greatly restrict the supply of new housing and make it unattainable for many, people go find housing somewhere else. Sometimes in other states.

    Photo by Tomek Baginski on Unsplash

  • Zoning in Silicon Valley, New Haven, and Austin

    Robert C. Ellickson’s recent paper, titled Zoning and the Cost of Housing: Evidence from Silicon Valley, Greater New Haven, and Greater Austin, really holds back when it comes to the shortcomings of zoning ordinances. Here’s an excerpt:

    Zoning, as practiced in much of the nation, gravely misallocates resources. Some distortions are micro, such as the mediocre siting of Anton Menlo housing [a project by Facebook], and the lack of walkable neighborhoods in New Haven suburbs. Others are macro. If Silicon Valley were more populous, it would be a world tech center even more attractive to IT workers. The misuse of zoning squanders land, adds to the nation’s carbon footprint, warps interstate migrants’ choices about where to reside, and helps price poor households out of wealthier neighborhoods that would offer better life prospects for their children.

    The paper focuses on three metropolitan areas: Austin, Silicon Valley, and New Haven. Of these three, Austin is the most permissive in terms of allowing new and denser housing. Silicon Valley and New Haven, by contrast, have done a great deal to limit intensification by adopting exclusionary policies.

    In 1970, home prices in Silicon Valley were only slightly above the national average. Today, they are by far the highest in the United States, which is, of course, partially a result of high demand (tech salaries) and low supply (zoning ordinances). Ellickson’s paper examines the effects of the latter.

    If you’d like to download a copy, click here.

    Photo by Carlos Delgado on Unsplash

  • Airbnb is powering new purpose-built short-term rental buildings

    This past weekend I was in a condo building here in Toronto with large signs in the elevator saying, “No Short-Term Rentals Including Airbnb Are Permitted. Trespassers Will be Prosecuted.” It was the first time I had seen anything like this, but it immediately signaled to me that the building must be having a problem with short-term rentals. Why else would you deface the elevators? There are some buildings that allow short-term rentals, but most don’t.

    However, over the last few years we have started to see purpose-built short-term rental buildings. In some cases, existing apartments buildings were “converted”, as was the case with Niido’s two properties in Nashville and Orlando. Here tenants in the building can rent both unfurnished and furnished apartments and then rent them out on Airbnb up to a maximum of 180 days per year. To date, I think these are the only two properties to use the “Powered by Airbnb” moniker, but more are on the way.

    The developer behind Niido — Newgard Development Group — recently launched a new Powered by Airbnb brand called, Natiivo. This one looks to be focused on for sale product, with two upcoming projects in Austin and Miami. Both projects will have hotel licenses in order to avoid any regulatory risk going forward. But this makes me wonder how materially different this model is from the condo-hotels we’re already familiar with.

    For landlords and developers, the goal is obviously to maximize rents and prices. Allowing (or explicitly encouraging) residents to rent out their place and earn some extra cash, should help with that. And given the way I started this post, we also know there’s a desire to do this, particularly in places with strong tourist demand like in Nashville and Miami. But the reviews are mixed. Not everyone wants to live in a hotel. But then again, not everyone wants to co-live. To each their own.

  • First 3D printed home in America

    The video below is a good follow-up to my recent post about the 100 million city and the rapid population growth that we are seeing in some parts of the developing world.

    If you can’t see the embedded video below, click here.

    [youtube https://www.youtube.com/watch?v=SvM7jFZGAec?rel=0&w=560&h=315]

    It’s a video about what is allegedly the “first permitted, 3D-printed home in America” – an 800 square foot home that was built/printed in Austin during SXSW in about 24 hours.

    The project is a partnership between New Story (a non-profit) and ICON (a construction technologies company), and the goal is to pioneer a fast and cheap housing model for the developing world.

    The cost for the above home is said to be about $4,000.

  • Follow the sun and sprawl

    image

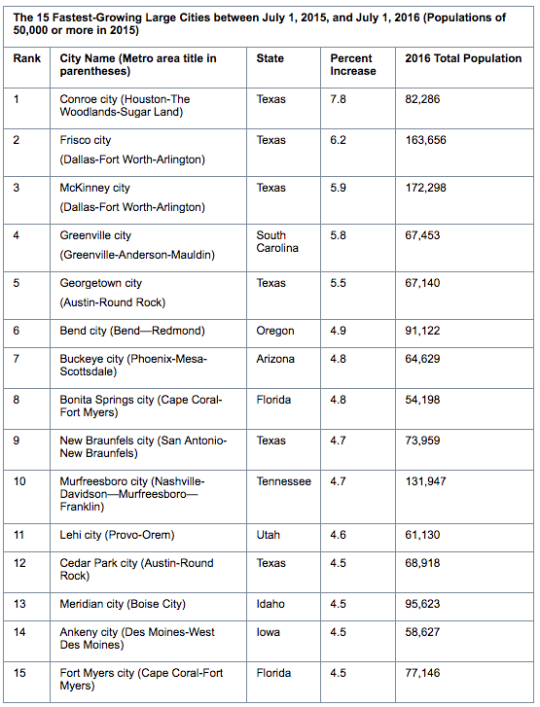
    The U.S. Census Bureau recently released it’s 2016 city and town population estimates. The press release can be found here.

    The headline isn’t a new one. Southern cities continue to grow quickly. This is not a new trend. Humans seem to like warm weather and the housing supply in southern cities tends to be more elastic. This keeps home prices relatively in check and allows the cities to more easily accommodate growth.

    From July 2015 to July 2016, 10 of the 15 fastest growing large U.S. cities were in the south (based on % growth). 4 of the top 5 were in Texas. 

    From 2010 to 2016, the population in large southern cities grew an average of 9.4%. Cities in the west clocked in at 7.3%. And cities in the northeast and midwest were at 1.8% and 3.0%, respectively.

    Two outliers near the top are Seattle and Denver. Since 2010, the population of these two cities grew 15.39% and 14.87%, respectively. I’m going to say it’s because of the skiing and snowboarding. Half-joking. For the top 25 large cities ranked by 2010-2016 growth rate, click here.

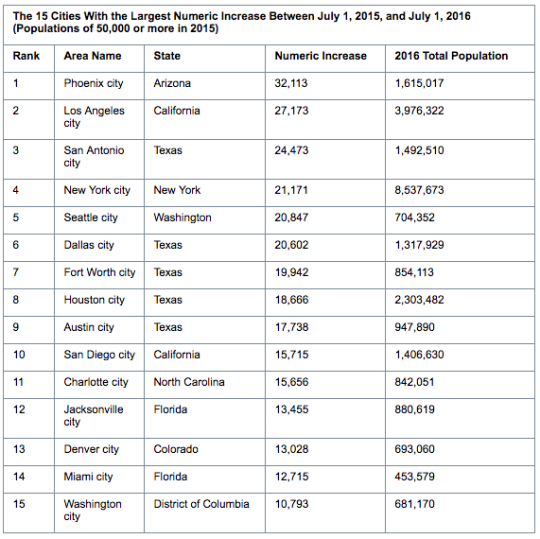
    In terms of absolute humans, Phoenix had the largest numeric increase between 2015 and 2016: 32,113 or about 88 people per day. After Phoenix it’s Los Angeles (27,173), San Antonio (24,473), New York (21,171), and Seattle (20,847). These are all city proper figures.

    It’s also worth noting which large cities aren’t growing. From 2015 to 2016, Chicago fell -0.32% and Detroit fell -0.52%. Philadelphia was only slightly positive at 0.19%. Going back to 2010, Chicago is still flat at 0.27% and Detroit is even more negative at -5.39%. Philadelphia is 2.5%.

    Follow the sun and the sprawl.

    The below charts are from the United States Census Bureau.

    imageimage

  • 10 city building predictions for 2016

    Dawn by Adrian Popan on 500px.com

    https://500px.com/embed.js

    Few things are better than waking up in the mountains and seeing a notification on your phone that 9″ of fresh snow have fallen overnight, bringing the 48 hour snowfall total to 16″.

    This is what people in mountain towns live for. They ski in the morning and then head to work in the afternoon. I heard a number of people on the mountain today saying that they, “want to be in the office after lunch.” It’s a lifestyle thing.

    On that note, today I’d like to focus on 10 city building predictions for 2016. I’ve been assembling this list over the past few weeks and now that I have had my fill of Utah powder for the day, I’m dedicating the rest of the afternoon to writing.

    These are never easy to put together. But here are my thoughts:

    1. We will see increased migration to secondary cities – outside of the alpha global cities – which offer a higher quality of life, more affordable housing, and the ability to live a particular lifestyle. This includes cities like Austin (creative startup hub) and Denver (outdoor recreation).
    2. As more and more cities wake up to the importance of lifestyle in attracting top talent, I think we will see a lot of cities follow the lead of Amsterdam and create “night mayors” or some other equivalent. These cities will begin to see nightlife as a competitive urban advantage.
    3. Global cities will start experimenting with different land use and property tax reform strategies to try and deal with rising income inequality and eroding housing affordability.
    4. We will see a barbell of residential unit sizes. We’ll see more well-designed small units as a way to try and promote housing affordability and we’ll see larger urban infill units for families and baby boomers who want to live/remain in walkable urban communities.
    5. In line with above, I think we will see a further rethinking of urban spaces. Flexible spaces, unique program mixes, and a continued blurring of public/private spaces. One example of this is the trend towards small private spaces surrounded by generous public/communal spaces.
    6. The Toronto and Vancouver real estate markets will continue to chug along because of low interest rates, a weak Canadian dollar, and increased foreign investment. That said, I think we will see more restraint when it comes to over-the-top luxury product.
    7. We will finally see a disruptive technology product that starts to get people in the real estate industry thinking that change is on the way. This will not be a product that ports an offline experience online; it will a new way of thinking about the industry.
    8. This will be the year that cities stop fighting Uber (and other similar marketplaces). Cities (and lobbyists) will finally accept that this is a new reality and then work to figure out the best way to create policy around it. Edmonton, Alberta has already become the first Canadian city to regulate Uber.
    9. Road pricing will get the attention it deserves in North America. Things will start out slow, but we will finally get ourselves on a path which recognizes that we can’t build our way out of traffic congestion in most major cities.
    10. I will publish a book on becoming a real estate developer.

    Many city building trends and shifts seem to happen in a global way. But I think it’s worth noting that a lot of these predictions were likely written with my North American lens on, and in some cases my Toronto lens on.

    It’s not easy sitting down and thinking about what will happen in the future. But it’s a worthwhile exercise. It forces you to take a stance and then, when the future does come, you can see how well you did. I saw Fred Wilson do this on his blog and I thought it was a great idea.

    Now I would love to hear what you think about my predictions and what yours are for this year. Please let us know in the comment section below.

  • What food is your city famous for?

    Yesterday I came across the above Instagram post by Bruce Mau Design, which pitted the Philadelphia Cheese Steak sandwich against the Montreal Smoked Meat sandwich in a “battle of borders.” It was to celebrate both Canada Day and American Independence Day.

    I thought this was an awesome idea, so I tweeted out the photo. Then Daniel Kay Hertz – who is a Senior Fellow at City Observatory and from Chicago – asked me: “Is there a Toronto equivalent?

    And that got me thinking. 

    Montreal has smoked meat, bagels, and poutine. Philly has the cheese steak. Chicago has deep dish pizza. Quebec City has maple sugar and tourtiere (a kind of meat pie). New Orleans has po’boy sandwiches. Boston has clam chowder. Austin has tacos. Seattle has crab. And the list goes on.

    But what is the quintessentially Toronto dish? Asian fusion food? Peameal bacon sandwiches from the St. Lawrence Market? I really don’t know. So I think we should decide on one right now. Think of it as an exercise in city branding.

    Leave your suggestion in the comments below and we’ll have a vote.

  • The most segregated cities in North America

    The Martin Prosperity Institute here in Toronto just released a new research study called Segregated City: The Geography of Economic Segregation in America’s Metros

    The report looks at the physical sorting and separation of advantaged and disadvantaged groups within cities. And it did so across 70,000+ Census tracts in the US and in terms of 3 different dimensions: income, education, and occupation.

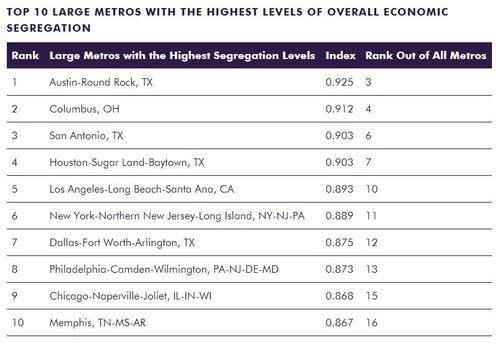
    Here are the most segregated “large metros” in the US:

    image

    Table Source: MPI

    And here are some of their broader findings – taken verbatim from page 9 of the study (click here for the full report):

    Economic segregation is positively associated with population size and density. It is also positively correlated to two other sets of factors that follow from metro size and density: how people commute to work and the breakdown of liberal versus conservative voters.

    Economic segregation tends to be more intensive in high-tech, knowledge-based metros. It is positively correlated with high-tech industry, the creative class share of the workforce, and the share of college grads. In addition, it is associated with two key indicators of diversity, the share of the population that is gay or foreign-born, which tend to coincide with larger, denser and more knowledge-based metros.

    Economic segregation is connected to the overall affluence of metros, with positive correlations to average metro wages, income, and economic output per capita.

    Race factors in as well. Economic segregation is positively associated with the share of population that is black, Latino, or Asian, and negatively associated with the share that is white.

    Economic segregation is associated with income inequality and even more so than with wage inequality. Its effects appear to compound those of economic inequality and may well be more socially and economically deleterious than inequality alone.

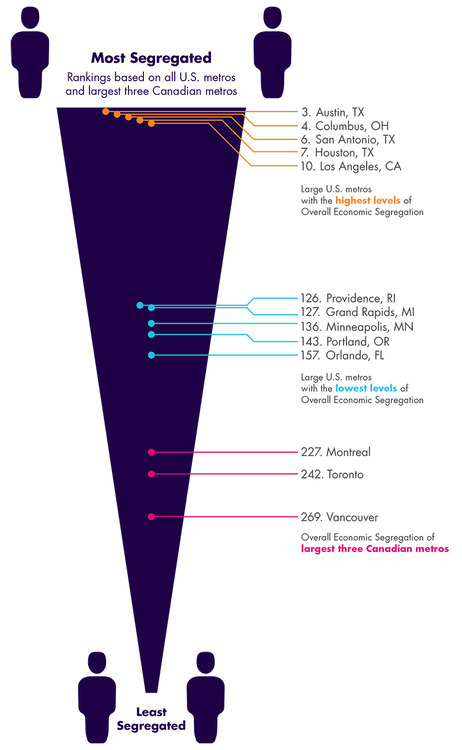
    The research team also looked at how Canada’s 3 largest metros – Toronto, Montreal, and Vancouver – compare to those in the US in terms of segregation. 

    The finding was that Canadian cities are overall less segregated than US cities, but that it should still be considered an area of concern. The most segregated of Canada’s 3 largest metros was found to be Montreal.

    image

    Image Source: MPI

    My view is that our economy is going through a profound shift right now. We’re transitioning from the industrial age to the information age. And in its wake, we’re seeing a number of disruptions, one of which appears to be rising inequality and segregation. 

    That’s not to say that I think this transition is a bad thing (I don’t think it is), but I do think we should be carefully considering and designing our future.

  • Top 10 (US) cities for young smart people

    image

    I’m always on the lookout for great websites and communities dedicated to cities. And today, thanks to a friend of mine, I found a new one called City Observatory. It’s my new favorite site for city geeks.

    They describe themselves as a “data-driven platform for sharing, analyzing and discussing the success of cities.” As soon as I read that, I immediately subscribed. I’m a big believer in using data to elevate the discussions happening around our cities and to cut through the bullshit.

    I’m looking forward to digging into more of their articles, but I did already take a look at the first report they published, which is called: “The Young and Restless and the Nation’s Cities”. Click here to download the PDF.

    What the report talks about is a demographic group that they refer to as “Young and Restless”, and which they define as being 25-34 years old and having a 4-year degree. And they focus on this group because they see it as critical to driving local economic development.

    They’re the next generation who are going to start those companies and drive growth and innovation. And since the data shows that as people age, they become less willing to relocate (which intuitively makes sense), cities today are quickly realizing that they need to capture this group of smart people while they’re still restless (i.e. mobile).

    So if this is important, which cities (in the US) are winning right now? Here are the top 10 cities via City Observatory:

    1. Washington D.C. 8.1%
    2. San Francisco 7.6%
    3. Boston/Cambridge 7.6%
    4. San Jose 7.5%
    5. Denver 7.5%
    6. Austin 7.0%
    7. New York 6.6%
    8. Minneapolis 6.6%
    9. Raleigh 6.5%
    10. Seattle 6.1%

    The percentage represents the portion of the population that’s 25-34 years old and has a 4-year degree. I’ve just listed the cities here, but in reality they reference the entire metro areas.

    Do any of the cities on this list surprise you? None are surprises for me. It’s more or less what I would have expected to see, except maybe for the absence of Chicago (it’s 12th according to this ranking).

    Is your city doing enough to capture this group?

    Image: Flickr