Daily insights for city builders, delivered every morning at 6 AM ET. I’m Brandon Donnelly — a Toronto-based real estate developer and founder of Globizen. I’ve been writing here since 2013.

Tag: athiscity

  • Ridesharing could help solve the last mile problem

    X by Keith Mokris on 500px.com

    https://500px.com/embed.js

    A few months ago I wrote a post about Uber’s new “Smart Routes” feature and ended by saying that it’s not just taxis who need to be thinking about platforms like Uber, it’s also public transit authorities.

    I said that because I think that multi-modal is already the new reality in terms of how we get around cities and because the line between different modalities is becoming greyer all the time.

    That’s why I was interested when I stumbled upon this NextCity article talking about how Lyft is starting – it’s still early days – to collaborate with transit authorities in order to make it easier for people to switch between public transit and its peer-to-peer ridesharing marketplace.

    Why might this matter? Here’s an excerpt from the article:

    “According to the company’s data, 25 percent of Lyft riders say they use the service to connect to public transit. In Boston, 33 percent of those rides start or end near a T station. And transit hubs like Chicago’s Union Station, D.C.‘s Union Station and Boston’s South Station are among the most popular destinations for its users, Lyft finds. So riders already see on-demand rides as a solution to the first mile/last mile problem. Lyft thinks it can do more.”

    These last 2 sentences are interesting. Public transit can often suffer from what is known as the first mile/last mile problem. This is a problem where riders find it difficult to get to the nearest transit route from their departing point or to their ultimate destination once they exit transit.

    Bikesharing can be used to solve this. But, clearly, so can ridesharing.

    The other important aspect of this emerging collaboration is that ridesharing apps can offer a lot of incredibly valuable data to transit authorities. If 25% of users are indeed using it to connect to public transit, then all of a sudden cities are getting a more complete picture of point A to B travel. (Among many other things.)

    But the question in my mind is now, who is going to and who should act as the overall steward in this multi-modal urban mobility network? 

    There are lots of different players involved. Some are public and some are private. But they all play a role in how we are going to continue moving around our cities.

  • A guide to digital marketplaces

    Version One Ventures – which is an early-stage venture capital fund based in Vancouver – recently published a free handbook called, A Guide to Marketplaces.

    Online marketplaces are really fascinating because they are perhaps broader in scope than you might initially think. For example, Uber is a marketplace. There’s a supply-side (drivers with cars) and a demand-side (people needing rides). Uber connects these two groups together and acts as a kind of digital middle person. Uber does not own any of the cars.

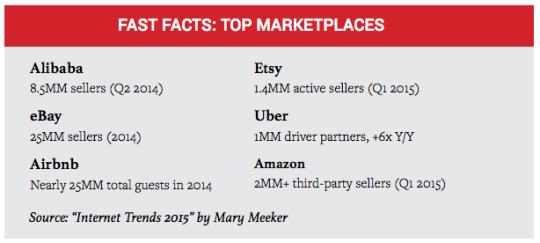
    This is an incredibly power business model and it can and is being applied in many different ways. Here are the top internet marketplaces (via the handbook):

    I have been interested in this space for years because I have been very curious as to why we haven’t seen more innovation when it comes to online real estate marketplaces. Yes, there are platforms like Zillow.com. But Zillow has not done to real estate what Uber is doing to urban mobility.

    My thinking is that it comes down to supply-side aggregation. Online marketplaces in general are hard to get started, which is why investors love them. They have defensibility. But real estate, in particular, is even harder to jumpstart compared to the incumbent models because of what I see as constraints on the supply-side.

    That’s why I am so excited about what BuzzBuzzHome.com is doing on the new construction side of the business. They are aggregating supply.

    If you’d like to download the guide to marketplaces in PDF, click here. It’s a great read and I’m glad that Boris and Angela took the time to assemble. Thank you 🙂

  • Blue, white, and red

    I had a few ideas bouncing around in my head today for things I could write about after I got home from the office and the gym. But now, I don’t feel like writing about any of them.

    So instead, I’d like to share this photo that I took around 9:00pm eastern time on Friday, November 13th, 2015. It’s a picture of the CN Tower lit up as the French flag.

    image

  • What a “buy now” button will mean for the new construction real estate industry

    Colored apartments by Pierre-Yves Babelon on 500px.com

    https://500px.com/embed.js

    Recently it has been in the news that BuzzBuzzHome.com – the new construction real estate site – will be launching a “buy now” feature in the new year (2016).

    This will allow people to buy condos and homes online with their credit card, which means that people will be able to pay the $5,000 deposit online and process all the paperwork that today happens within a sales office.

    This is huge.

    If you’re somebody who has used a computer and the internet before, the process today feels archaic. Typically you go online to register for a project and then somebody will call you to arrange an appointment. If you ask them to email you the price sheet and floor plans ahead of time, they’ll almost always tell you that they can’t do that and that you’ll need to come into the sales office for an appointment. 

    But what about if you end not liking the floor plans and you’re about to waste a few hours of your time? Too bad. The sales funnel requires you to be present in person. This is nothing against the many talented sales professionals working in new construction; it’s just that if I can design and price out a car online and if Mark Cuban can buy a $40 million jet online, then I should be able to shop for a new condo online.

    BuzzBuzzHome has been chipping away at the current model for years and they’ve managed to get a lot more information online than was previously available. When Matthew and Cliff first launched BuzzBuzzHome in the late 2000s it was almost unheard of for developers to put any sort of pricing and floor plans online. Now they at least have some of that on their site. I’m glad they stuck with it.

    Because what’s equally exciting about what BuzzBuzzHome is doing is that in order to offer a “buy now” feature, they also need to have an accurate account of all developer inventory on hand. And so alongside this “buy now” feature they’re also building out a full cloud-based inventory management system for developers. 

    This means that BuzzBuzzHome will soon be managing the supply-side of the new construction marketplace. Think of the data and analytics you can extract from a platform like this. It’s going to bring much greater transparency to this industry.

    But if your business is in any way connected to the new construction real estate market, I would take this morning and think about how the above innovations could impact your business model. I can think of a few winners and losers.

    Some of you might be thinking that people aren’t going to make the biggest purchase of their life online. But I would bet the farm that many people will. I know I would.

  • The value equation

    On Tuesday night I attended a great industry event that Quadrangle Architects organized about mid-rise buildings. 

    Mid-rise buildings (somewhere around 4-12 storeys) are all the rage in Toronto these days. But there are many challenges associated with this building typology and this was an event to talk about them and hopefully push things forward.

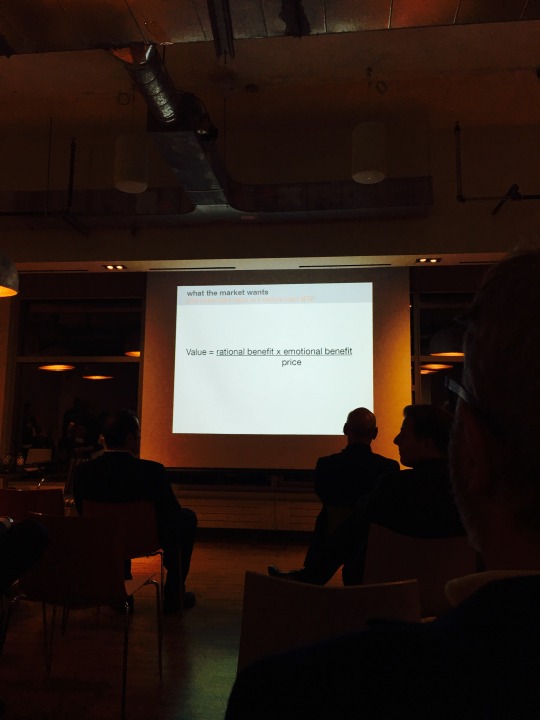
    One of the speakers at the event was Jeanhy Shim of Housing Lab Toronto. And I’d like to share one of her slides here:

    It reads:

    Value = (rational benefit x emotional benefit) / price

    I believe she admitted to taking it from someone at Bruce Mau Design. But that’s okay. That’s how ideas build. What I really like about it is that it attaches a value to the things that are difficult and sometimes impossible to measure: the emotional stuff.

    As I mentioned in this post over the weekend, we are all obsessed with the quantitative side of our businesses. In the case of development, we look at prices, per square foot prices, apartment sizes, and the list goes on. And we often reduce our “products” to these sorts of key metrics.

    But if you’re competing just on numbers, then you’re missing a big and important part of the equation. People consume things – and housing is no different – for a number of different reasons. We buy things because of how it makes us feel, how it reinforces our sense of self, how it improves or promises to improve our lives, and so on. These are all harder to measure than square footage. 

    But we are living in a data driven world and more and more of this type of information will become available for city building. If you and your business can get your head around it first, you’ll have a huge advantage. 

  • Real estate + tech

    If you’re interested in tech and tech products, you might be familiar with a platform called Product Hunt that helps you discover new products/startups on a daily basis. They launched back in 2013 and have since become an important part of the startup ecosystem.

    Here in Toronto, the Product Hunt community has been incredibly active with organizing regular meetups. Every 2 months they host an event, which includes a keynote speaker, 3 product demos from local startups, a panel discussion, and of course the usual drinks.

    The next Product Hunt Toronto event (#7) is scheduled for Thursday, November 26th at 6pm and the focus is on digital products serving the real estate industry. Back when I became obsessed with this space, this would have been considered pretty niche. But today there’s a tremendous amount of interest in the overlap between real estate and tech. And I’m thrilled to see that.

    If you’re also interested in this space, you should grab a ticket right now. They just went on sale yesterday, but usually sell out within a few days. At the time of writing this post, there are only 82 tickets left. I’m also going to be delivering the keynote talk. So I hope to see you there 🙂

  • Timeline of tall buildings completed in New York since 1908

    The Council on Tall Buildings and Urban Habitat recently published an interesting report called, New York: The Ultimate Skyscraper Laboratory.

    The money shot is this image here:

    It is a timeline of all tall buildings (over 100 meters) completed in New York since 1908 when the Singer Building was completed. At the time, but only for a year, that was the tallest building in the world.

    The gray bars represent the total number of buildings completed each year. And the colored dots represent specific completed buildings and their asset class (office, residential, mixed-use, hotel, and so on). It’s interesting to see the dips. During World War II, high-rise construction basically stopped.

    Check out the full report if you’d like to see a bigger version of the graph.

  • Balancing oil and ideas

    Colorado Sunset by Travis Bredehoft on 500px.com

    https://500px.com/embed.js

    Canada is a resource rich country. And one of the things that commonly happens to countries with a lot of resources is that they begin to myopically focus on the immediate gains from resources at the expense of long term innovation and economic development. 

    This is known as the “resource curse.”

    The Martin Prosperity Institute here in Toronto recently published a report that looks at this exact topic: Canada’s urban competitiveness through the lenses of its resource economy and its knowledge economy. In the end, Richard Florida and Greg Spencer conclude that two can and should work together, but that we need to stop neglecting our cities:

    “The oil and gas industry is not necessarily a constraint on the creative economy, but in the past decade or so it has come to dominate thinking around economic development policy-making. It is time to use the resources from the energy economy to build a more secure future as an urban knowledge economy. We can also use
    talent and technology to deepen and expand the resource economy.”

    And one of their key recommendation is something I have argued for many times here on Architect This City:

    “A New Federalism for Cities: It is time to give cities the taxing and spending powers they require. Cities must be given more control over their own destinies if they are to prosper
    in the 21st century.”

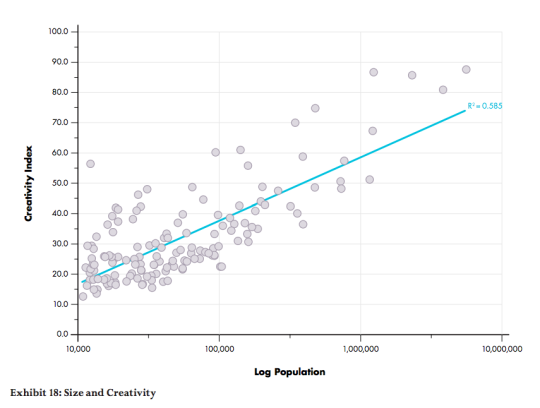
    Now, here are a few interesting charts from the report.

    This first one looks at the relationship between a city’s population and its creativity levels. The two are positively correlated, which means that, in this context, bigger is better.

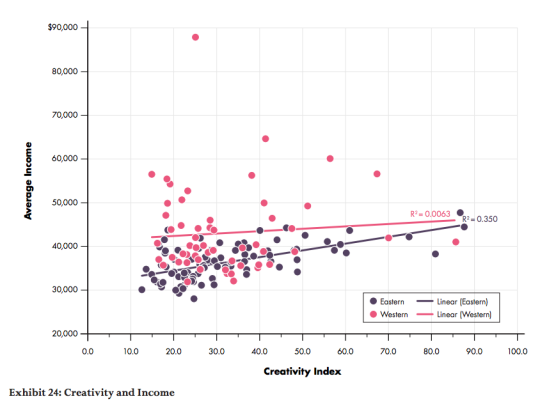
    This second one splits Canada in half – east and west – and then looks at how average income levels are affected by creativity levels (the knowledge economy). Here we see that in eastern cities, income levels are positively correlated with creativity levels. But in western cities, changing creativity levels have almost no impact on income levels. 

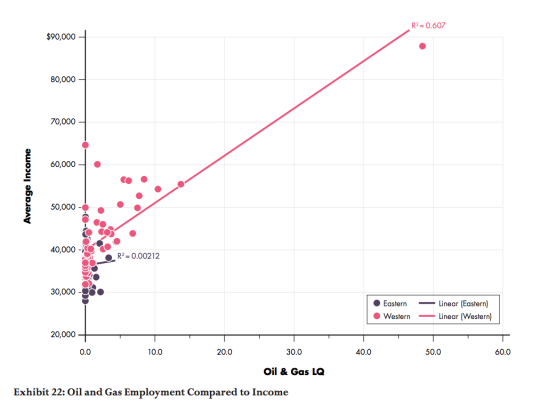
    Finally, this third chart compares the relationship between oil and gas employment (LQ = location quotient) and average income levels. What it finds is that income levels and oil and gas employment are positively correlated in the west, but there’s almost no relationship in eastern cities. 

    The way to read this chart is to think of the LQ as the employment multiple relative to the national average. So for example, a LQ = 10 means that the oil and gas employment levels are 10 times the national average. As you probably guessed, the pink dot way out on the right is Fort McMurray.

    If you’d like to read the entire report, you can do that here. I hope that our new Prime Minister, Justin Trudeau, will read reports like this and spend more of his efforts investing in our knowledge economy – which means investing in our cities.

  • Condo building identities according to Instagram

    I am very interested in the social side of buildings. What I mean by that is that we usually focus on the quantitative side. We look at sale prices. We look at average prices per square foot. We look at reserve fund balances. And as I recently argued, this is all very important stuff. I think we should do much more to make this data publicly available.

    But there’s also a side to buildings that’s harder to measure: the human side. Sale prices and staged MLS listings don’t tell you what the people who live in the building are like. What the vibe will be like at the pool during the summer. If you can expect to find dog poo in your elevators. But when you live in a multi-family building, I think most people will tell you that the qualitative side also matters.

    So this morning, I thought I would run a little experiment and pull the top Instagram photos for a random sampling of relatively new condo buildings in Toronto. These are public photos that have been uploaded and tagged with that building’s location ID. 

    Obviously there’s an inherent bias since I figure Instagram users probably lean towards Millennials. Also, the top posts could be easily skewed by a small number of heavy influencers. But I still thought it would be interesting to see if any particular identities started to emerge. And I do see some differences that reflect what I would have expected. I wonder how these might relate to the original marketing for the buildings.

    What do you think of the photos below?

    Feel free to do the same for your building and post the photo in the comments below. That could make for a really interesting discussion. My building is the first photo.

  • #donthave1million

    Tiny Park by David Brookfield on 500px.com

    https://500px.com/embed.js

    After I wrote this week’s post about Chinese homebuyers in Vancouver, I was surprised to learn about the racism debate that flared up in the city / on Twitter. I guess this really is a touchy subject. (See: #donthave1million)

    My reaction to the research was: Great to see someone (Andy Yan) putting in the time to try and better understand a market phenomenon. It’s painful how opaque real estate markets can be. Let’s get even more data so that we can make even better policy decisions. I didn’t read it as: let’s deliberately single out a race.

    Because the reality is that we all knew this was happening.

    Bloomberg recently published an interesting and related article that talks about China’s money exodus and how the Chinese logistically get their money out of the country. There are restrictions in place. 

    But first, here are two snippets from Bloomberg that describe the order of magnitude we’re talking about:

    This flood of cash is being felt around the world, driving up real estate prices in Sydney, New York, Hong Kong and Vancouver. The Chinese spent almost $30 billion on U.S. homes in the year ending last March, making them the biggest foreign buyers of real estate. Their average purchase price: about $832,000.

    In total, UBS Group estimated that $324 billion moved out last year. While this year’s numbers aren’t yet in, during the three weeks in August after China devalued its currency, Goldman Sachs calculated that another $200 billion may have left.

    Now here’s how it is being done:

    It works like this: Chinese come to Hong Kong and open a bank account. Then they go to a money-change shop, which provides a mainland bank account number for the customer to make a domestic transfer from his or her account inside China. As soon as that transaction is confirmed, typically in just two hours, the Hong Kong money changer then transfers the equivalent in Hong Kong or U.S. dollars or any other foreign currency into the client’s Hong Kong account. Technically, no money crosses the border – both transactions are completed by domestic transfers.

    And here’s a snippet that stood out for me because it shows how easy this has become:

    While the first exchange has to be set up face-to-face, customers can place future orders via instant-messaging services such as WhatsApp or WeChat, and money changers set no limit on how much money they can move.

    Given the scale and complexity of this issue – housing affordability – I have to believe that cities and policy makers would be far better off with more, rather than less, information. I hope we can work towards that.