Daily insights for city builders, delivered every morning at 6 AM ET. I’m Brandon Donnelly — a Toronto-based real estate developer and founder of Globizen. I’ve been writing here since 2013.

Tag: atc

  • The Social Life of Small Urban Spaces

    “It is difficult to design a space that will not attract people. What is remarkable is how often this has been accomplished.” -William Whyte

    In 1980, the sociologist and urbanist William Whyte published a revolutionary book called The Social Life of Small Urban Spaces

    The ambition was to discover why some urban plazas are successful and why many others fail. And to do that, he went out and studied urban plazas throughout New York using video and simple observation, such as head counting.

    His work has been hugely influential for architects, designers, and other urbanists. But if you think about how often we fail at creating urban spaces that actually attract people, I think it’s worthwhile revising what Whyte discovered way back in the 70s and 80s.

    Some of the principles – such as providing places to sit – are dead simple and intuitive. But again, a lot of urban spaces suck. So we’re clearly not doing it.

    The other thing I feel we often forget is that it’s not just the space itself that matters, it’s also the urban fabric around it. The Seagram Building in New York plays a central role in Whyte’s work as an example of a successful urban plaza. 

    But we can’t forget that Mies van der Rohe’s simple gesture of setting the tower back from the street is strengthened by the remaining urban fabric and the activity along Park Avenue. The plaza acts as a kind of release.

    Alongside the book, Whyte also published a 60 minute video. If you’ve never seen it, I highly recommend you watch it when you get a chance. Click here if you can’t see the video below.

    [youtube https://www.youtube.com/watch?v=MjxXTsHgc8g&w=420&h=315]

    To close out this post, I thought it would be fun if everyone shared their favorite public urban space in the comment section. It can be in your city or it could just be a place you’ve visited.

    To kick things off, I’m going to go with with a space that’s close to home: Berczy Park. It has lots of places to sit, including movable chairs. There’s a great water feature. And it’s well connected to the rest of the area and surrounding streets. I often sit there during lunch or when I just want to think.

    It’s also in the midst of a revitalization and I’m excited to see that come together.
  • The ROI of cycling infrastructure

    Toronto can’t make up its mind right now as to whether it would like to invest in additional cycling infrastructure. 

    Of course, we have a history of vacillating on topics like this. And I think it’s because we’re at a tricky inflection point. We are weaning ourselves off of the car, but most parts of the city remain underserved by transit and heavily dependent on the car.

    So today I thought I would share some numbers from a research study that was published last year by Stefan Gössling of Lund University and Andy S. Choi of the University of Queensland. It’s called, Transport transitions in Copenhagen: Comparing the cost of cars and bicycles.

    Much of the focus of the paper is on the cost-benefit analysis that the City of Copenhagen uses to make its cycling investment decisions. Here is an excerpt from ScienceDaily:

    “If the costs to society and the costs to private individuals are added together, the impact of the car is EUR 0.50 per kilometre and the impact of the bicycle is EUR 0.08 per kilometre.

    The study by Stefan Gössling and his colleague also shows that if we only look at costs/benefits for society, one kilometre by car costs EUR 0.15, whereas society earns EUR 0.16 on every kilometre cycled.

    “The cost-benefit analysis in Copenhagen shows that investments in cycling infrastructure and bike-friendly policies are economically sustainable and give high returns,” says Stefan Gössling.”

    So there you have it. Now I thought we could debate this in the comment section. Your thoughts?

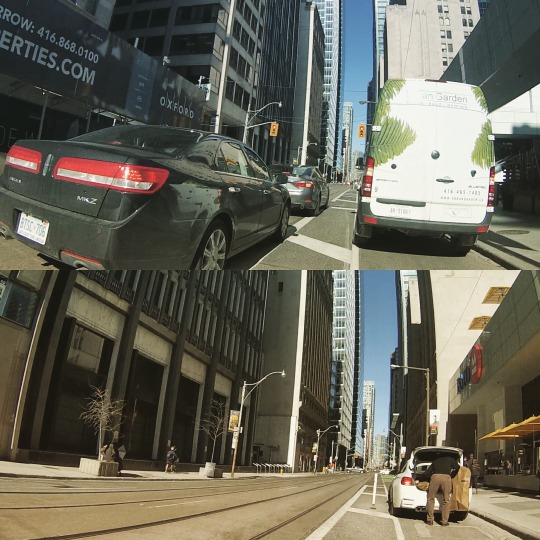
    P.S. The images at the top of this post were taken by me using my new GoPro bicycle handlebar mount.

  • Lists, disciplines, and AI

    I have a bit of an obsession with my calendar, lists, and goals. On the home screen of my phone I have Wunderlist, Evernote, Google Drive, and 2 calendar apps (more on that in a second).

    This obsession is probably one of the reasons I write this blog. I like writing, drawing, and documenting things. It helps me sort through my thoughts. I have everything from a list of cities I want to visit to a list of billion dollar business ideas (yes it’s really called that).

    But the other reason I like to keep lists is because – as I said in this post – I’m trying to be cognizant about overcommitment. And when I write things down, it serves as a reminder of what I’m doing and what I’m allowed to focus on.

    One of the ways I do that is through repeatable goals (or disciplines). These are non-negotiable things that I’ve committed myself to and that I just have to grind out – such as writing on this blog every day. I can tell you that some blog posts come out a lot easier than others. But I’m a firm believer that there are few substitutes for just showing up every day and putting in the work.

    On that note, let me tell you why I have 2 calendar apps on my phone. I’ve been testing out the latest version of Google Calendar because of a new feature they rolled out this month called Goals.

    What it does is automatically schedule repeatable goals. So for instance, you could tell it that you want to work out 3 times a week for 1.5 hours each time and that you prefer to work out in the evenings. It will then go and find 3 times for you to do it every week for all of eternity. 

    If a conflict arises, that’s no problem. As soon as you enter another appointment, the app will automatically reshuffle your calendar goals to make sure that you still get your 3 workouts in. It’ll even learn your preferences as you make changes to these appointments over time. 

    So far I’ve been finding this feature really useful. I used to do this for myself manually, but now I have a computer that does it for me. Even better.

    It’s also a glimpse into the future that Sundar Pichai, CEO of Google, was talking about on a recent earnings call:

    “We’ve been investing in machine learning and AI [artificial intelligence] for years, but I think we’re at an exceptionally interesting tipping point where these technologies are really taking off,” he said. “That is very, very applicable to businesses as well. So thoughtfully doing that externally we view as a big differentiator we have over others.”

    “In the long run, I think we will evolve in computing from a mobile-first to an AI-first world,” Pichai said in closing. “And I do think we’re at the forefront of developments.”

    For the past 5 years, it’s been all about mobile. But now much of the tech community – including the CEO of a pretty big company – is saying that artificial intelligence is next. What do you think this will mean for cities?

  • What is this a building for ants?

    One of the things you’ll often hear people deride at cocktail parties is the trend toward smaller urban dwellings. They get called “shoeboxes” and “cubby holes in the sky.” So let’s unpack that a bit today and try and better understand the economics behind it all.

    When a new building is being developed, pretty much everything gets normalized to a per square foot (or square meter) number. 

    This is important because saying that building X cost $50 million to build and building Y cost $100 million to build doesn’t tell you much if the buildings are completely different. 

    However, saying that building X cost $500 per square foot to build and building Y cost $475 per square foot to build, tells you that building Y, despite being more expensive in absolute terms, was actually cheaper and/or more efficient.

    The same is true on the revenue side. And typically, developers are looking (struggling) to meet a certain per square foot number in order to make the project financially feasible. 

    For instance, let’s say you’re building a 100,000 sf condo building. Once you subtract the non revenue generating spaces, you might determine that you need 85,000 sf x $600 per square foot in revenue in order to make the project feasible.

    But there’s a back and forth game that needs to be played here. You have to ask yourself: for the product that I’m hoping to build, does $600 psf translate into something that people can actually afford?

    You might think: everyone keeps telling me at cocktail parties that condos in this city are too small. So I’m going to build a bunch of 1,800 sf, 3 bedroom condos. Based on the above, these homes would be priced at around $1.08 million (1,800 sf x $600 psf). Your on-site signage would read: “Condos coming soon. From the low $1 millions.”

    But wait a minute, how many families can afford a condo north of $1 million? Some could, but definitely not the majority. So then you determine through rigorous market analysis that $600,000 would be a better number. That is something that is within reach of more families.

    But then you look at the math and realize that if you build that same 1,800 sf home, your per square foot revenue number now drops to $333 psf ($600,000 / 1,800 sf). 

    Given that you bought the land for $100 psf buildable (market price in the area) and that your construction costs alone are going to be $250 psf, you realize that you’re now underwater ($100 + $250 psf > $333 psf) without even adding in any soft costs (consultant fees, city fees, and so on). If you showed this to your investors on the project, they would throw you out of the room.

    So instead of building that 3 bedroom condo at 1,800 sf, you say to yourself: what if I made it 1,000 sf? You’re confident that your architect could lay out a terrific condo at that size and it now magically gets your per square foot revenue number back up to $600 psf. 

    This solves two problems: it returns the project to positive feasibility and it keeps the total sale price within reach of more people. It promotes greater affordability. So you go ahead and do it. Boom – shrinking urban dwelling.

    All of this is not to say that this is fair or unfair, good or bad. It is simply to say that this is the way it often is.

  • A real estate dynasty without heirs

    Throughout history, real estate has been a tremendous source of wealth for a lot of people. Many family dynasties were created by accumulating property, holding it, and then riding the valuation wave.

    Here in Toronto, there was the Reichmann family. At one point they had created the largest real estate company in the world (Olympia & York). But I’m not sure exactly how much of that wealth remains today following the company’s bankruptcy in the early 90s. That was a tough time in Toronto real estate.

    In line with this, the NY Times recently published a fascinating account of the Wendel family in New York. In terms of how they conducted themselves, they were the polar opposite of some of today’s real estate families (i.e. Trump), but they certainly built an empire.

    Here are two snippets from the NY Times:

    In the early 20th century, the Wendels were perhaps the most powerful landlords in New York City, a dynasty with more than 150 properties in Manhattan worth over $1 billion in today’s dollars. The Wendels were the delight of the local papers, for, rich as they were, the family — six sisters and a brother, all unmarried — lived together in a shuttered mansion without electricity on the northwest corner of Fifth Avenue and 39th Street, and dressed in grim Victorian garb that had gone out of style half a century earlier. Tour buses regularly pulled up in front of “the House of Mystery.”

    Alongside their austere lives, they also practiced a strict and disciplined approach to investing: 

    Never mortgage a property; never sell anything; never pay for repairs; and never forget that Broadway moves uptown at a rate of 10 blocks a decade.

    In fact, they were so draconian in their approach, that the sisters were supposedly prohibited from marrying. Unions were not allowed because that, according to the NY Times, “would disperse the accumulated property and put it under other names than Wendel.”

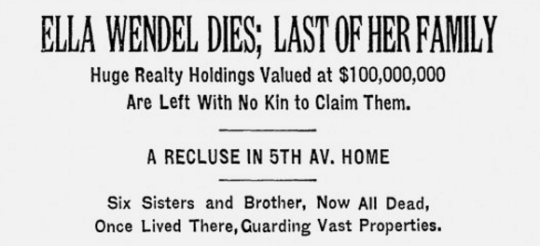
    But in the end, this meant that the last Wendel – Ella, who died in 1931 – died alone and with no one to pass along the empire to. So instead it was distributed to various charities and the inevitable “cousins” that come out of the woodwork when a rich person passes.

    I guess the moral of the story here is the old saying that you have to “give to receive.” From the sounds of it, the Wendel family didn’t like to do that.

    Image from March 15, 1931 obituary

  • Automobile vs. tram

    In grad school, I was fortunate enough to be a teaching assistant for a class called Urban Real Estate Economics, which was taught by Dr. Richard Voith. It was one of my favorite classes. So if you ever find yourself at the Wharton School, I would highly recommend it.

    Richard is also the President of a consulting firm in Philadelphia called Econsult Solutions. And I think a lot of what they focus on would be of interest to the audience of this blog. Their focus is on urban economics, real estate economics, transportation, public policy, and – you get the idea.

    Recently, he wrote a post called, Moving Cities: Berlin, where he outlines some of the transportation decisions that West and East Berlin made in the second half of the 20th century. 

    What I found most interesting was how the trams of East Berlin were stigmatized to represent communism and a centrally planned economy. On the other hand, West Berlin was all about the free market, and the symbol for that was none other than the automobile. That meant that the trams had to go. 

    Here is a quote that he shares from B.R. Shenoy, first published in August 15th, 1960:

    “The main thoroughfares of West Berlin are near jammed with prosperous looking automobile traffic, the German make of cars, big and small, being much in evidence. Buses and trams dominate the thoroughfares in East Berlin; other automobiles, generally old and small cars, are in much smaller numbers than in West Berlin. One notices cars parked in front of workers’ quarters in West Berlin… In contrast with what one sees in West Berlin, the buildings [in East Berlin] here are generally grey from neglect, the furnishings lack in brightness and quality, and the roads and pavements are shabby…”

    My favorite line: “…jammed with prosperous looking automobile traffic.”

    Of course, Berlin wasn’t the only city to eschew trams in the 20th century. Detroit and Los Angeles both did exactly the same thing. But in Berlin, this philosophy wasn’t applied equally across the urban fabric. And that’s what makes it a particularly interesting case study.

    I don’t know Berlin well enough to comment specifically, but Richard writes about how parts of East Berlin remained quite pedestrian friendly compared to West Berlin. That makes intuitive sense, given that it didn’t reorient itself towards the car in the same way that the West did. That being the case, I am curious to what extent those parts of the city may be benefiting today.

    In any event, you should also give Richard’s article a read. You can do that here.

  • Nest or cave?

    I was recently introduced to the work and writing of Japanese architect Sou Fujimoto. One concept that he writes about that I really like is the idea of nest vs. cave.

    The way Fujimoto describes a cave is that it’s a naturally occurring and pre-existing condition. It is exists independent of humans. So if and when a human decides to occupy a cave, he or she must assimilate their lives to that which is already there. They have to deal with the ambiguity of the spaces because it is not clear how everything should be used.

    A nest, on the other hand, is something completely created by and for the benefit of a person or animal. It would not exist without someone creating it and so it is prescriptive and functional in a way that a cave is not.

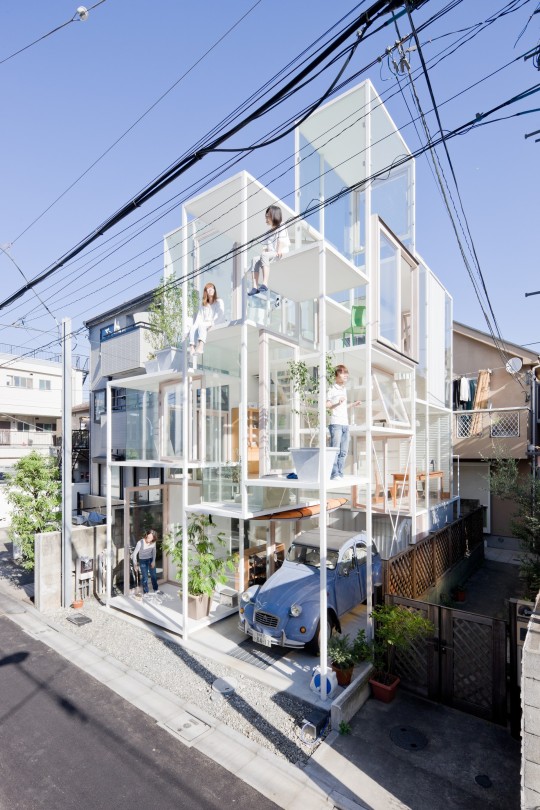
    Fujimoto is interested in exploring architecture that is analogous to caves. Which is why he designs houses like this one (House NA) in Tokyo:

    In most countries, a house like this would not meet code and would be illegal. But in Tokyo it’s obviously allowed. And his hope is that the owners will discover new and unintended ways to interact with the unusual pairing of levels and platforms.

    However, I think about this juxtaposition differently – likely incorrectly in the mind of Fujimoto.

    I’m actually more interested in nests. Because in a way, mass produced housing is like a cave. It exists whether or not we decide to occupy it. And it is generally created to appeal to lots of people, rather than to the idiosyncratic tastes of one person. So when someone does occupy it, they invariably end up trying to shape it.

    But not to the extent of a nest. A nest is custom. It is what you would build for yourself given the opportunity to do so. And that thought is really appealing to me. Maybe it’s because I don’t like the ambiguity of a cave. That could be a possibility.

    I could also be thinking about it differently because I tend to think of Japanese homes as being quite individualistic. Since Japanese people generally don’t care about resale value, they don’t have the same fixation with marketability and future value. That means they’re more likely to just build what they want.

    I’d love to have my own nest.

    Image: Wall Street Journal

  • Coffee shops vs. fried chicken

    When it comes to a real estate market, there are always the typical metrics: sale prices, rents, vacancy and so on. But I’m always interested when somebody looks at the market in a different way and comes up with other kinds of metrics.

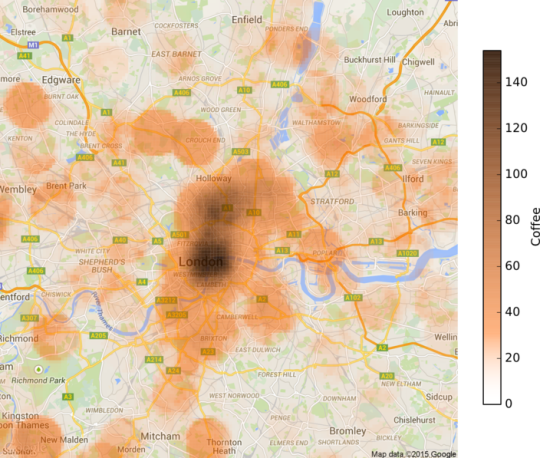
    That’s why I was intrigued when I stumbled upon this post by Sam Floy, where he looks at the concentration of coffee shops and friend chicken shops across London in order to determine which neighborhoods are in fact “up and coming.”

    To give you a taste, here’s his coffee shop map:

    His thinking was that if a neighborhood had a high density of coffee shops, a low density of fried chicken shops, and relatively low house prices, then it could probably be thought of as up and coming. 

    Coffee shops are often considered to be leading indicators of urban change (i.e. gentrification), and, well, friend chicken places I guess speak to a different kind of neighborhood.

    These sorts of playful studies aren’t going to tell you exactly which numbers you should be plugging into your development pro forma. But I think unconventional analyses can sometimes tell you a bit more of the story behind the numbers.

  • Sprawling, but affordable

    The Wall Street Journal recently published an interesting article that ties in nicely with two of my recent posts. My post about North American population growth and my post about the San Francisco pro-development group known as BARF.

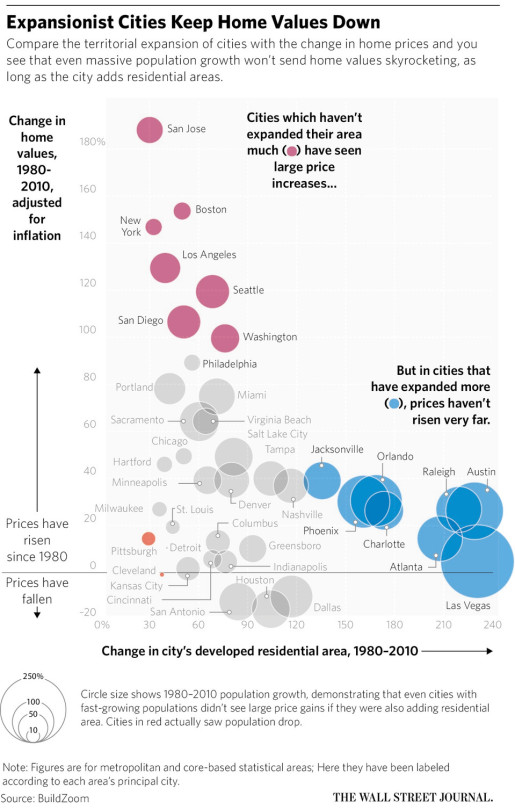
    The WSJ article is about the growing divide between affordable and expensive cities in the US. And the argument is that expansionist, or sprawling, cities are better at suppressing home values and maintaining affordability:

    “The developed residential area in Atlanta, for example, grew by 208% from 1980 to 2010 and real home values grew by 14%. In contrast, in the San Francisco-San Jose area, developed residential land grew by just 30%, while homes values grew by 188%.”

    Now, here’s a chart saying that same thing:

    The reality is that greenfield development (suburban sprawl) generally has far fewer barriers to development than urban infill development. So I’m not surprised to see cities like Las Vegas, Atlanta, and Phoenix clustered towards the bottom right.

    At the same time though, I’m obviously not convinced that sprawl is an optimal outcome. I think there are other costs not reflected in the chart above. So what’s the best solution here, assuming we want to build inclusive mixed-income cities?

  • Gray on gray on gray

    This past weekend was gorgeous in Toronto. I always love seeing the city come to life after the winter and last weekend was the first sign of that this year.

    Being the fair-weather cyclist that I am, I had the flat fixed on my single speed bike and I was ready to go by the weekend. I managed to test out the GoPro handlebar mount that I mentioned last week but, quite honestly, the footage was so jittery and bouncy that it made me nauseous to watch it. So I need to rethink my city geek filming strategy. 

    (Sidebar: GoPro needs to make it easier to turn their raw footage into content that is actually worth sharing.)

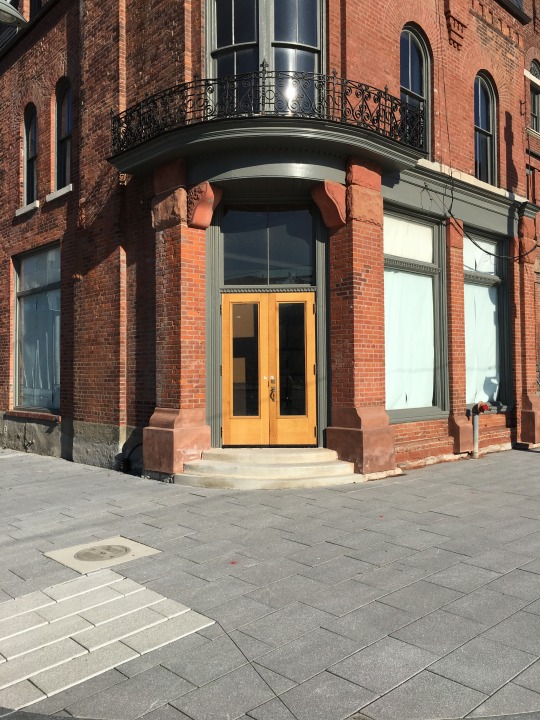
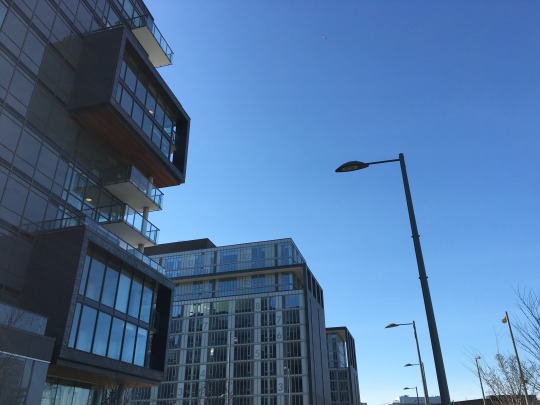
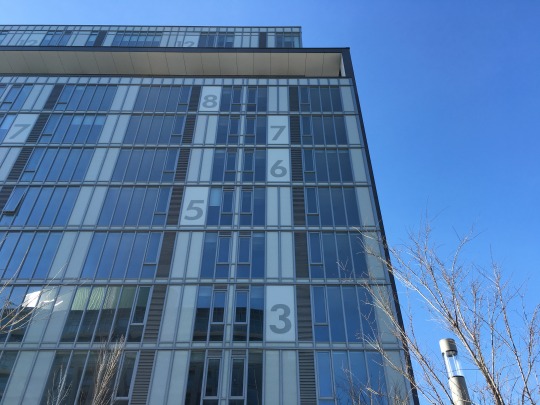
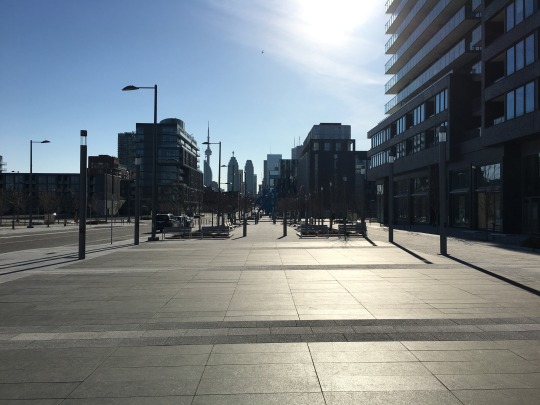
    Still, I had a good ride over to the new Canary District on the east side of downtown. The gates just recently game down, so I was itching to take a look at it. Here are a couple of photos to give you some context for the rest of this post:

    None of the retailers have moved in, so the area currently feels like Toronto post zombie apocalypse (to use a friend’s description of the neighborhood). But all of the bones are in place for an incredible downtown neighborhood.

    Here are some of my thoughts as I was riding around:

    The opening of this neighborhood repositions the Distillery District. Initially, the Distillery District struggled as a kind of island on the edge of downtown. But thankfully they stuck to their initial vision for the community and now they get the benefit of this new mixed-use anchor to the east of it.

    Trinity Street to the north of the Distillery District proper is a fantastic opportunity to not only extend the magic of the Distillery northward, but also “plug” the area into Front Street East, which is the primary east-west spine that connects the Canary District back to the downtown core. I hope we (the city, developers, and so on) take advantage of this.

    The Front Street Promenade running through the Canary District and connecting into Corktown Common (park) is going to be an absolutely magical urban space once the restaurants, cafes, and retailers open up. I can’t wait for this to happen. Live Work Learn Play has been orchestrating the retail component.

    Finally, why are all of the buildings gray? 

    Gray brick. Gray window wall. Gray spandrel panel. It’s gray on gray on gray. We’re playing into that boring Canadian stereotype here. I hope the subsequent developments introduce some wild colors. Although some red brick to tie into the Distillery District would work well too. The best nearby architecture (just to the north) is the River City complex by Saucier + Perrotte.

    Notwithstanding the gray, I’m super excited about the Canary District and I am generally bullish on the east side of downtown. If you’ve had a chance to visit, I’d love to also hear your thoughts in the comment section below.