Daily insights for city builders, delivered every morning at 6 AM ET. I’m Brandon Donnelly — a Toronto-based real estate developer and founder of Globizen. I’ve been writing here since 2013.

Tag: atc

  • Honduras is building a decentralized land registry system using the bitcoin blockchain

    Tegucigalpa by José López on 500px.com

    https://500px.com/embed.js

    I am very interested in bitcoin because of the underlying technology behind it – namely the blockchain. And that’s because it has the potential to be applied to and to disrupt many different industries and sectors, including real estate.

    That’s why I was fascinated to learn over the weekend that Honduras, with the help of a Texas-based company called Epigraph, is in the midst of building a permanent land title registry system based on the blockchain architecture.

    This is particularly important for Honduras because the country currently suffers from a significant amount of land fraud. And according to Reuters, 60% of land is actually undocumented. So the impact of a secure blockchain-based registry system could be transformational.

    Obviously the impetus for Honduras doing this is to fix the broken system that they currently have in place. But there’s no reason that it couldn’t also be done in the developed world to reduce transaction costs and improve overall transparency in the marketplace.

    Hopefully Honduras will show us how it is done.

    If you’re curious and would like to learn more about the blockchain, here’s a short primer. Once you’ve read that, you can then check out this post I wrote talking about how the blockchain could be applied to real estate.

  • Housing completions in Toronto from 1996 to 2014

    Whenever I read studies that cite census data, I’m often left feeling like the data is out-of-date. 

    Five years – which is how often Canada conducts its national census – is a long time. Somebody could move to this country for school, complete a 4-year degree, and then leave, and we wouldn’t even pick it up in our data.

    Thankfully, we’ve at least reinstated the long-form census for next year. Here are the questions, if you’re curious.

    But all of this is a digression. 

    This morning I read through a housing report that the City of Toronto published in October of this year. It’s about housing trends. And I wanted to share the below chart that covers housing completions for the period of 1996 to 2014. Keep in mind that this is for the City of Toronto, and not the Greater Toronto Area.

    What it shows is that over this 18 year period, 78% of all housing completions in this city have been either low-rise or high-rise condominiums/apartments. The remaining 22% is a mix of detached and semi-detached houses and townhouses.

    However, this 22% is an average. 

    Detached and semi-detached housing completions declined from 22% in the 1996-2001 period to 10% a decade later. And row and townhouses declined from 16% to 6% during this same period.

    At the same time, “many” of the housing units in this 22% were actually replacing existing and older housing stock. That is, according to the report, many were “knock-downs” and rebuilds. In these cases, it means that the completions actually do not represent net new housing units. So in reality, the supply of new single-family housing is even lower than it appears in the chart above.

    When you look at all of this, it should come as no surprise to you that our current combination of low interest rates and low supply has been leading to huge price increases on the single-family side of the market.

    And it’s for this reason that I believe Toronto will eventually start to look towards allowing more low-rise intensification. Laneway housing, as one example, would represent virtually 100% new ground-related housing in already built up areas. Where else are we going to find that kind of housing opportunity?

    So in my view, it is a question of when, not if, this will happen.

  • This U.S. housing boom is different

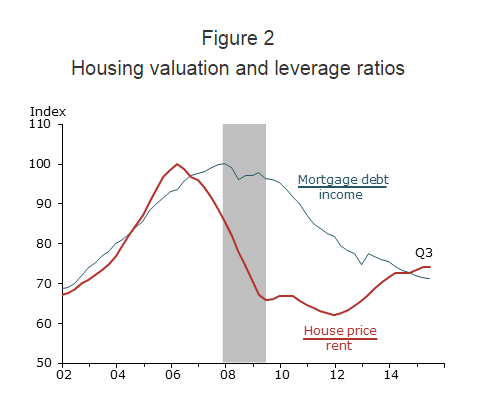
    Just a few days ago, The Federal Reserve Bank of San Francisco published an interesting research study where they argue that this U.S. housing boom is different than that of the early 2000s.

    During the last boom, U.S. home prices peaked in 2006 and then dropped about 30% in the wake of The Great Recession. Since then prices have rebounded – almost to their pre-recession levels. This has some people asking whether this story is headed towards the same ending.

    But the FRBSF is saying no:

    “We find that the increase in U.S. house prices since 2011 differs in significant ways from the mid-2000s housing boom. The prior episode can be described as a credit-fueled bubble in which housing valuation—as measured by the house price-to-rent ratio—and household leverage—as measured by the mortgage debt-to-income ratio—rose together in a self-reinforcing feedback loop. In contrast, the more recent episode exhibits a less-pronounced increase in housing valuation together with an outright decline in household leverage—a pattern that is not suggestive of a credit-fueled bubble.”

    And here’s the chart:

    Source: Flow of funds, Bureau of Economic Analysis (BEA), CoreLogic, and BLS. Data are seasonally adjusted and indexed to 100 at pre-recession peak.

  • The rise of the East

    I love the work that LSE Cities (London School of Economics) is doing with Urban Age. If you haven’t yet checked out their site, you should do that now. If you’re a city geek, it’s the kind of site you can get lost in for hours. Especially if you’re a sucker for great diagrams like I am.

    Here’s one I found today that shows where cities are growing in the world:

    Each circle represents a city (well, metropolitan area). The dark green dot is the city’s population in 1950. The lighter green dot is the city’s population in 1990. And the yellow dot is the city’s projected population by 2025. Click here for a larger version of the map.

    What’s fascinating about this diagram is that you can so clearly see how the most significant population growth has shifted away from the West to the rest of the world and in particular Asia. That is, those dots have more yellow than green.

    We, of course, already knew this was happening. And population is just one dimension. But it’s still interesting to see this in diagram form. We are living through the rise of the East. And this diagram is a reminder of that.

  • British stock brick

    On Tuesday night architect Jamie Fobert spoke at the Daniels Faculty at the University of Toronto. Fobert’s practice is based in London, but he is a graduate of the Daniels Faculty well before it was called that.

    I unfortunately wasn’t able to attend, but I did get on to looking at his work. And I want to share two of his projects that stood out for me. Both are in London.

    The first is the Luker House:

    imageimage

    And the second is the Levring House:

    imageimage

    What I love is how subtle the detailing is in both projects. The Luker House uses a “British stock brick” to mimic its context. But at the same time, it is applied in such a minimal way that the project feels entirely contemporary.

    You can see that same philosophy in the Levring House, which was built to complete an historic mews house.

    Finding the right balance between old and new is not always easy. But I like how Jamie Fobert has done it with these two London homes.

  • Project: Under Gardiner — Re-imagining Toronto’s urban infrastructure

    image

    If you’ve been reading this blog since the summer, you might remember that there was a period of time where I wrote incessantly about the removal of the eastern portion of Toronto’s elevated Gardiner Expressway.

    Ultimately City Council didn’t vote the way I believe we should have. But I remain hopeful that somehow we will manage to do the right thing and replace it with a surface boulevard. Now – before the east waterfront gets developed – is the right time to make that happen.

    However, the western portion of the Gardiner Expressway is a different story. The adjacent area is already developed and it is unlikely that this highway is going anywhere any time soon. So for the foreseeable future, we are stuck with it.

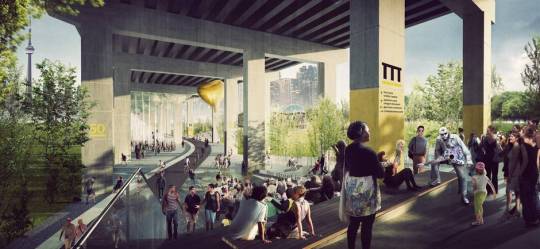
    And if we are stuck with it then we should make the absolute best of it – even celebrate it. Which is why Toronto is buzzing right now with the news that a 1.75 km stretch under the western portion of the Gardiner Expressway will be remade into a vibrant public space by 2017. This is thanks to a generous $25 million private donation. (Is that enough money?)

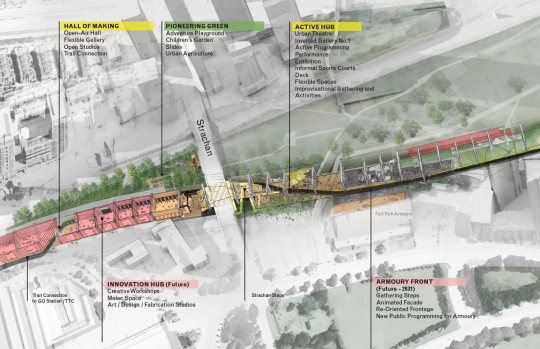
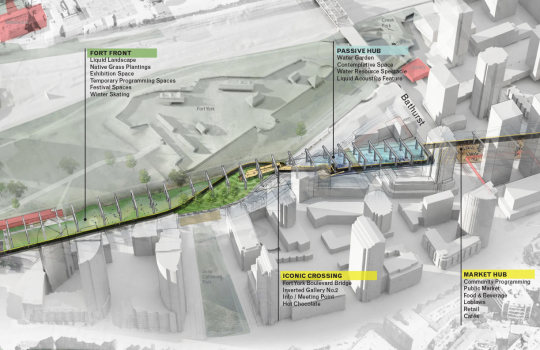
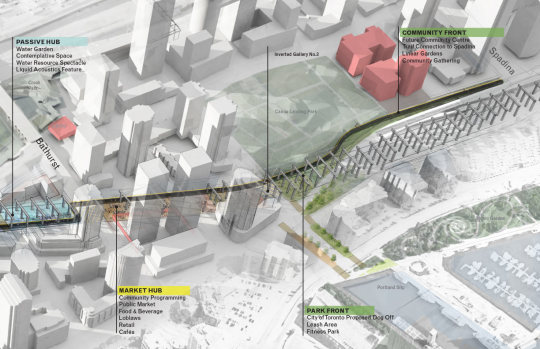
    Here’s the overall programming strategy, going from west to east (via undergardiner.com):

    imageimageimage

    And here are two renderings:

    imageimage

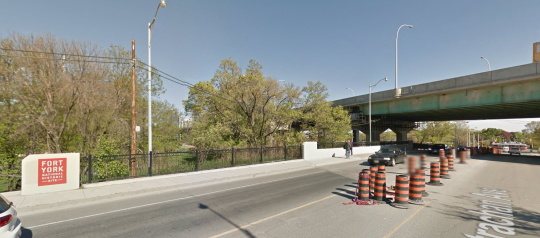
    The first phase is expected to run from Strachan Avenue in the west all the way to Spadina Avenue in the east. That is what is shown above.

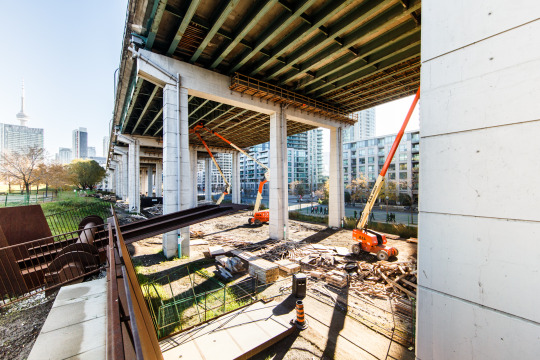
    Two key elements include a grand stair at Strachan Avenue, which looks like this today (via Google Streetview):

    image

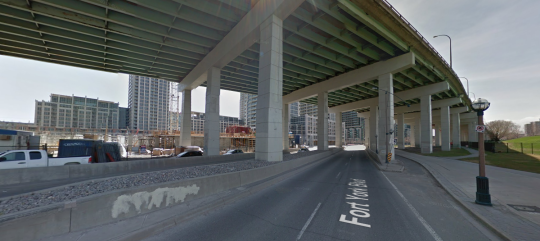
    And a pedestrian bridge over Fort York Boulevard, which looks like this today:

    image

    All of this doesn’t change my opinion of the Gardiner East, but I do believe that this is an incredibly exciting opportunity for the city. Today the space under the Gardiner is a void in our public realm.

    I also think it could be quite interesting to have these two opposing urban conditions along the central waterfront. A linear underpass park in the west and an open air boulevard in the east.

    It’s also exciting to see private money step up. It goes to show you that there is no shortage of passionate city builders in this town.

    Top image courtesy of Harry Choi Photography.

  • My blogging methodology

    I often get asked about the methodology behind my blogging. (Though I have written a few posts about it already.) 

    Most people seem to assume that I sit down on the weekends. Draft a content calendar. Write a bunch of posts. And then queue them up for the coming weeks. 

    I don’t do any of that (besides sit down).

    Instead, I get up every morning and I write something. Sometimes I wake up with an idea that’s been bouncing around in my head and sometimes I wake up with no idea what I’m going to write about. 

    In the latter case I just start reading the internet over breakfast until something interesting catches my attention.

    But in both cases, what you are reading about is what I am thinking about at that moment in time. 

    Because in addition to a blog about cities, this blog is about a discipline and a habit. It is about taking time every day to step away from tasks, sort through my thoughts, and write something. It’s one thing to think about something; it’s another thing to write about it.

    And so as much as I hope you all get value out of this blog, it also very much about the personal benefits I receive from doing this same thing over and over and over again.

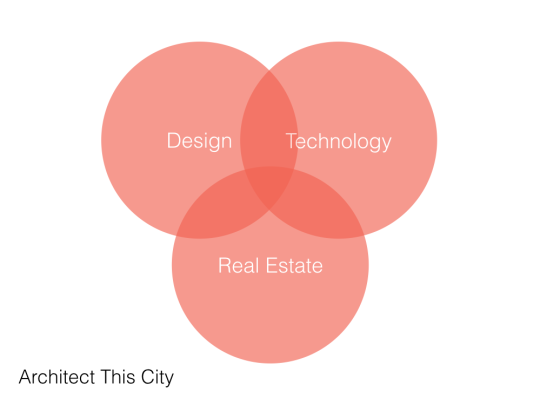
    Now, in terms of the content, the focus is obviously on city building. But I’m more specifically interested in the following 3 areas and their overlap:

    If you’re a regular reader you know this.

    I didn’t set out to focus in this way, but it just happened over time. This is what I’m passionate about and so I naturally started applying it to our discussion on cities and city building.

    And finally, in terms of writing style, I’ve found myself adopting a particular structure.

    I often start with a personal note – almost as if this were purely a personal blog. Then I dig into a particular city building issue and try to uncover one particular way of looking at it. And then I end with a decisive position. I’ve seen this format on other blogs and I really like it.

    Obviously I don’t always follow this structure. For example, sometimes I haven’t made up my mind on a particular issue. But I try to. I lean towards the belief that a decisive wrong answer is better than a wishy washy right answer. So I push myself to take stances and have an opinion. 

    But in the end, the goal of every post is simply to present one idea for all of us to think about and then discuss. I’d like to believe that it keeps us all sharp. Hopefully it’s working for you.

  • Ridesharing could help solve the last mile problem

    X by Keith Mokris on 500px.com

    https://500px.com/embed.js

    A few months ago I wrote a post about Uber’s new “Smart Routes” feature and ended by saying that it’s not just taxis who need to be thinking about platforms like Uber, it’s also public transit authorities.

    I said that because I think that multi-modal is already the new reality in terms of how we get around cities and because the line between different modalities is becoming greyer all the time.

    That’s why I was interested when I stumbled upon this NextCity article talking about how Lyft is starting – it’s still early days – to collaborate with transit authorities in order to make it easier for people to switch between public transit and its peer-to-peer ridesharing marketplace.

    Why might this matter? Here’s an excerpt from the article:

    “According to the company’s data, 25 percent of Lyft riders say they use the service to connect to public transit. In Boston, 33 percent of those rides start or end near a T station. And transit hubs like Chicago’s Union Station, D.C.‘s Union Station and Boston’s South Station are among the most popular destinations for its users, Lyft finds. So riders already see on-demand rides as a solution to the first mile/last mile problem. Lyft thinks it can do more.”

    These last 2 sentences are interesting. Public transit can often suffer from what is known as the first mile/last mile problem. This is a problem where riders find it difficult to get to the nearest transit route from their departing point or to their ultimate destination once they exit transit.

    Bikesharing can be used to solve this. But, clearly, so can ridesharing.

    The other important aspect of this emerging collaboration is that ridesharing apps can offer a lot of incredibly valuable data to transit authorities. If 25% of users are indeed using it to connect to public transit, then all of a sudden cities are getting a more complete picture of point A to B travel. (Among many other things.)

    But the question in my mind is now, who is going to and who should act as the overall steward in this multi-modal urban mobility network? 

    There are lots of different players involved. Some are public and some are private. But they all play a role in how we are going to continue moving around our cities.

  • A guide to digital marketplaces

    Version One Ventures – which is an early-stage venture capital fund based in Vancouver – recently published a free handbook called, A Guide to Marketplaces.

    Online marketplaces are really fascinating because they are perhaps broader in scope than you might initially think. For example, Uber is a marketplace. There’s a supply-side (drivers with cars) and a demand-side (people needing rides). Uber connects these two groups together and acts as a kind of digital middle person. Uber does not own any of the cars.

    This is an incredibly power business model and it can and is being applied in many different ways. Here are the top internet marketplaces (via the handbook):

    I have been interested in this space for years because I have been very curious as to why we haven’t seen more innovation when it comes to online real estate marketplaces. Yes, there are platforms like Zillow.com. But Zillow has not done to real estate what Uber is doing to urban mobility.

    My thinking is that it comes down to supply-side aggregation. Online marketplaces in general are hard to get started, which is why investors love them. They have defensibility. But real estate, in particular, is even harder to jumpstart compared to the incumbent models because of what I see as constraints on the supply-side.

    That’s why I am so excited about what BuzzBuzzHome.com is doing on the new construction side of the business. They are aggregating supply.

    If you’d like to download the guide to marketplaces in PDF, click here. It’s a great read and I’m glad that Boris and Angela took the time to assemble. Thank you 🙂

  • Blue, white, and red

    I had a few ideas bouncing around in my head today for things I could write about after I got home from the office and the gym. But now, I don’t feel like writing about any of them.

    So instead, I’d like to share this photo that I took around 9:00pm eastern time on Friday, November 13th, 2015. It’s a picture of the CN Tower lit up as the French flag.

    image