Daily insights for city builders, delivered every morning at 6 AM ET. I’m Brandon Donnelly — a Toronto-based real estate developer and founder of Globizen. I’ve been writing here since 2013.

Tag: altus

  • Development approval timelines in the Greater Toronto Area

    Altus Group recently completed a study for BILD (Building Industry and Land Development Association) that looked at the various factors that might be contributing to housing affordability and supply issues here in the Greater Toronto Area. One area that they looked at was development approval timelines, and I thought these were two interesting charts:

    What this is suggesting is that approval timelines don’t seem to really vary based on project size. Whether you’re rezoning for 3-50 homes or 400-500 homes, it’s probably going to take you a similar amount of time. This in turn creates a strong incentivize to want to develop bigger projects. Among other things, it brings down the “number of days per unit” metric shown in this second chart.

    I have spoken anecdotally before about minimum project size inflation, and here’s some data to support why that is happening. But it really is too bad. We should be doing more to incentivize smaller infill projects. Our cities need development at all scales.

  • Hard costs are insane right now

    Marlon Bray over at Altus recently shared the above chart on LinkedIn. Normally I only go on LinkedIn about once every quarter, if that. But thankfully our team likes to follow nerdy charts and so it got circulated around.

    The chart is from Statistics Canada (table 18-10-0135-01 to be exact) and what it shows is the % change per annum of their construction price index, going all the way back to 1989. It is good context for the massive cost increases that we are all currently working through.

    Increasingly, I think that most people in the industry feel as if we’re now reaching a tipping point. Costs — both hards and softs — cannot continue to go up like this. At some point supply will start to taper off or even shut off. The former has likely already started.

  • Only 2 new single-family homes sold in Toronto last month

    Altus Group just released its January (2018) sales figures for the new home market in the Greater Toronto Area.

    – 1,251 new homes sold last month. 886 of these (or 70.8%) were condominium apartments (everything from stacked townhouses to high-rises).

    – This is down from 2,429 homes in 2017 and 2,118 homes in 2016.

    – Almost half of the new home sales (609 homes) came from Toronto alone. And almost all of these (607 homes) were condominium apartments. Only 2 new single-family homes sold in the city last month.

    – Benchmark price for single-family homes was $1,229,454, which is a 19.6% increase from January 2017.

    – Benchmark price for condominium apartments was $714,430, which is a 40.8% increase from January 2017.

    That last increase really stands out. I did a double take.

    But as we’ve talked about before, low supply and high prices seem to be pushing more buyers toward condos – and larger ones at that.

    Recently we’ve been seeing an increase in both average unit sizes and prices per square foot.

    According to Altus, sales of new single-family homes in the GTA last month were the lowest for a January since before 2000.

  • The year of the condo

    Over the past 5 years or so, real estate headlines in the Greater Toronto Area have often focused on the rapid appreciation of low-rise housing. High-rise housing simply wasn’t appreciating at the same rate – at least in aggregate terms.

    But 2017 has brought a different story. 

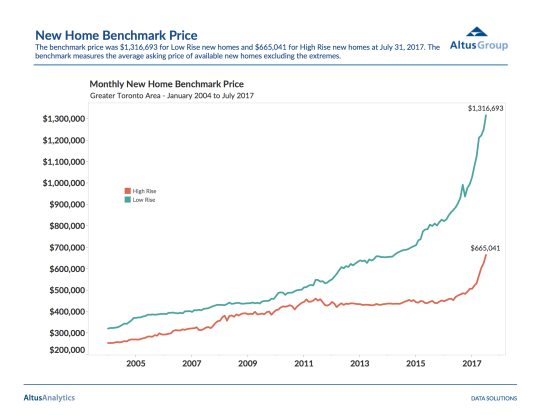
    If you look at BILD’s “New Homes Monthly Market Report” (data provided by Altus Group as of July 2017), you can see that high-rise pricing is now on a similar trajectory to low-rise pricing.

    Here is that graph:

    image

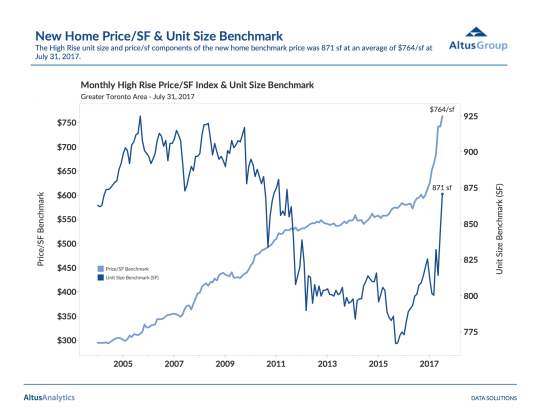
    This sharp uptick in pricing is also apparent when you look at the average price per square foot of new high-rise inventory. As of July, it was $764 psf across the GTA. See below.

    At the same time, average unit sizes have also jumped up to 871 square feet. So not only are new high-rise homes becoming more expensive on a normalized basis, they are also getting bigger, which further increases prices.

    image

    I recognize that we’re only seeing data up to the end of July, but, from the looks of it, 2017 is shaping up to be an extraordinary year for the condo.

    Of course, part of the reason this is happening is because remaining inventory for both low-rise and high-rise product is hitting 10-year lows. We’re back to the topic of supply.

    If you’re curious how some of these numbers have changed from the month prior (June 2017), check out this post.

  • February housing numbers

    The Building Industry and Land Development Association (BILD) announced its February (2017) numbers today for the Greater Toronto Area. Here are some of the highlights:

    – At the end of February, there were 324 detached homes available in developer inventories. Ten years ago, this number was was 12,064 (detached only). 

    – If you consider all low-rise homes (detached, semi-detached, and towns) the above numbers are 1,001 (2017) and 17,304 (2007), respectively.

    – Average price of a new detached house is now $1,469,449. For all ground-related housing – again, including semis and towns – it’s $1,081,013.

    – There were more than twice as many condo apartments sold than low-rise homes in February.

    – Condo inventory is also dropping and reached a low of 10,342 units.

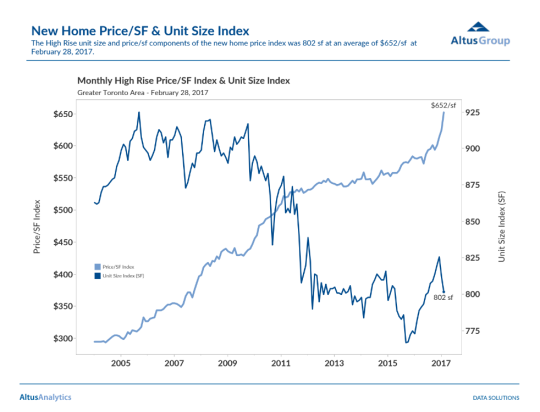
    – Average price of a new condo increased to $652 per square foot and the average unit size decreased to 802 square feet.

    Here’s that information in a chart from Altus Group:

    image

    The overall story here continues to be about decreasing inventory and increasing prices. There’s also the ongoing shift from low-rise to higher density housing, which I don’t view as a bad thing.