Daily insights for city builders, delivered every morning at 6 AM ET. I’m Brandon Donnelly — a Toronto-based real estate developer and founder of Globizen. I’ve been writing here since 2013.

  • The year of the laneway

    Earlier this week, Metro News published an article saying that it’s going to be a big year for laneways in Toronto:

    “2016 is going to be the year where the evolution of our laneways lands at the forefront of our public realm strategy,” said Downtown Yonge BIA chair Mark Garner, who’s heading up the revitalization of O’Keefe Lane near Ryerson University.

    In addition to the Downtown Yonge BIA, much of this is being spearheaded by the non-profit group, The Laneway Project. This year they are expected to unveil plans for the revitalization of 3 laneways in the city – one of which is right in my backyard.

    I have a lot of respect for what The Laneway Project, the Downtown Yonge BIA, and others are doing in support of rethinking our laneways. And so today I just wanted to publicly thank them for their efforts. Thank you 🙂

  • What do you think of parking stackers?

    One of the things that’s becoming a lot more common in Toronto is parking stackers. For small infill sites there’s simply no other way to fit in the parking. You can’t lay out a traditional parking garage.

    But while it’s still relatively new for Toronto, I think many of you would be surprised by how many projects there are in the pipeline right now that plan to use parking stackers. In the next 5 to 10 years, they are going to be quite common.

    Some of you might be wondering how they work. There are a bunch of different solutions, from stackers to elevators and palettes, but here’s an example of a triple car stacker:

    In this case, there’s a below grade pit and an open space that goes up into the second floor. This way each car remains accessible without having to move any of the others. If you want the car on the top shelf, just lower the other 2 into the pit. If you want want the car on the bottom shelf, just raise the other 2 into the second floor space (which is what’s shown above).

    But here’s what I’m really curious about: How do you feel about parking stackers? Would you live an apartment or condo where that was how you had to park your car? Or would it be a deal breaker? Please let us know in the comment section below.

  • Should you buy a car or just take Uber?

    Urban dawn by Raymond  on 500px.com

    https://500px.com/embed.js

    My friend Evgeny published a great blog post today called, On Car Ownership And The Future Of Transportation

    And in it he made the argument that instead of buying a car and an expensive downtown Toronto parking spot (average price: $40,000 – 60,000), most of us urbanites would be better of just taking a taxi or Uber.

    This got me thinking: At what point does it really make sense to completely forgo owning a car? (Full disclosure: I own both a car and a downtown parking spot.) So I decided to dig into the numbers a bit more and compare 4 mobility options:

    • Owning a car ($25,000 upfront) + downtown parking spot ($40,000 upfront) and driving yourself everywhere
    • Taking a regular taxi exclusively ($3.25 base + $1.75 per km)
    • Taking an UberX exclusively ($2.50 base + $1 per km)
    • Or, taking a futuristic driverless car everywhere (here I assumed $1.50 base + $0.25 per km)

    With the above numbers, I then assumed 15,000 km traveled per year and an average trip length of 15 km (so 1,000 trips per year). The trip length and number of trips per year matter because of the “base fare” that is charged when you take a taxi or Uber.

    I also assumed that the cost of owning a car is $0.60 per km (estimated from this Globe and Mail article) and that there is an opportunity cost to NOT renting out your downtown parking spot ($200/month). That is, every month that you spend driving yourself around and parking your car, you are forfeiting parking revenue.

    Finally, I looked at a 10 year time horizon and then “discounted” all the costs back to today’s dollars so that I could compare each mobility option.

    So what did I find?

    image

    What this says is that if you’re driving 15,000 km per year (average trip length 15km), then you’re better off taking UberX everywhere, as opposed to going out, buying a car and parking spot, and driving yourself around.

    But does this hold true at different travel distances?

    Based on my model, once you hit around 18,000 km per year, then you’re better of with option 1 (owning a car). That’s because the per km savings associated with driving yourself around are enough to offset the upfront costs of the car and parking spot.

    On the flip side, when you drop below 7,500 km traveled per year, even a regular taxi starts to make sense. That’s because you’re simply not traveling enough to reap the benefits of owning a car/parking spot. Again, high upfront costs; lower per km operating costs.

    Of course, there are a number of things I didn’t consider in my model. For one, most people finance their car and parking spot (it is bundled into their home mortgage). So I’m sure there are ways that you could change the above outcomes using leverage.

    At the same time, I didn’t account for the fact that when you’re being driven around (as opposed to driving around) you have the flexibility of doing work, responding to emails, and so on. If you want to attach a value to your time, then the scale would tip back in favor of taxis and Uber.

    But all of this was really just to make one point: look how cheap it could be to ride around in a driverless car. When that becomes the reality in our cities, which it will, it’s going to completely transform our current beliefs around cars, parking, and many other things.

    I guess that’s why General Motors just invested $500 million in the peer-to-peer ridesharing company, Lyft. They know the shit is coming.

  • Tweet of the Week: The Creation of Manchester

    I may never do another “Tweet of the Week” on ATC, but I couldn’t resist sharing this one of New Year’s Eve on Well Street in Manchester’s city centre.

    //platform.twitter.com/widgets.js

    The photo was taken by Joel Goodman and first appeared in this online picture gallery.

    But then Roland Hughes of the BBC remarked that its composition was similar to a Renaissance painting and that the guy in blue laying in the middle of the street, reaching for his beer, could be thought of as a parody of the reaching God in Michelangelo’s The Creation of Adam. So he tweeted it out. Since then it has gone viral.

    For those of us who weren’t in Manchester on New Year’s Eve, we clearly missed one epic party.

  • Art is the new steel — a photo essay of Hamilton, Ontario

    Today, myself and a few others spent the afternoon urban exploring Hamilton, Ontario with Thomas Allen of the blog, Rebuild Hamilton. If you don’t read his blog, you should. Since he started writing about 3 years ago, he has really emerged as the online voice of Hamilton’s urban resurgence.

    If you’re from Toronto, you’ve probably been hearing rumblings about good things happening west of the city. Rumblings about people leaving overpriced Toronto for greener and more affordable pastures in Hamilton, and even that it was destined to become the Brooklyn of Toronto. That basically means Millennials, trendy coffee shops, and beards. (For the record, Thomas’s beard is very nice.)

    With all this talk of affordable housing and beards, I decided that it was time to make a pilgrimage. Below is a short photo essay of what we saw.

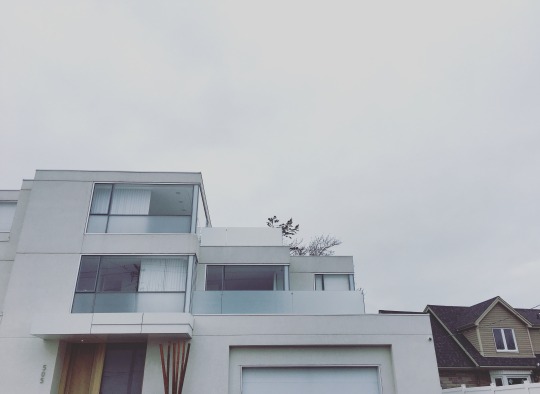
    We started the day east of Hamilton where we found this beauty along the waterfront. I don’t know who designed it, but it’s called the Cube House and it was construction managed by Toms + McNally Design. You’re going to want to click through to their website to see the interior photos. 

    image

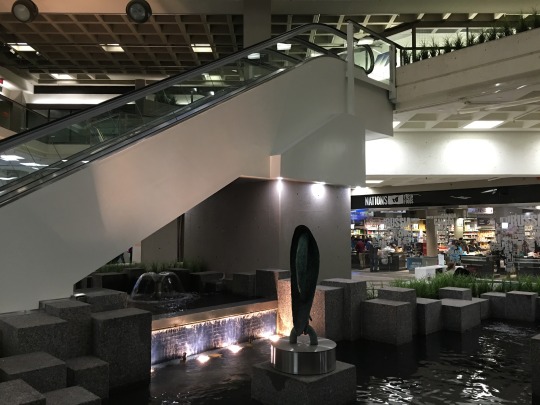
    We then made our way downtown to Jackson Square. Jackson Square is one of two downtown malls (the other is the post-modern City Centre Mall). It has seen a lot of investment in recent years and I was impressed to find a thriving grocery store. 

    image

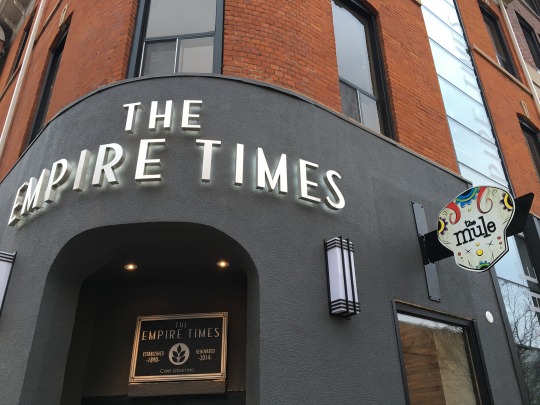
    Then came a taco and craft beer pit stop at The Mule. I would definitely recommend this spot if you happen to find yourself in the area.

    imageimage

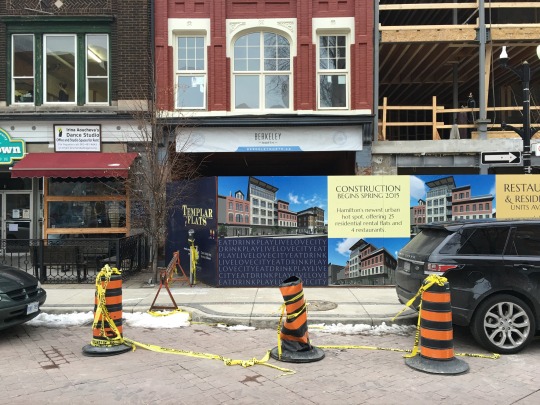
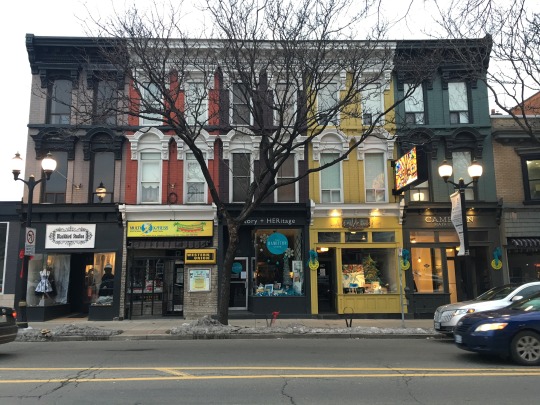
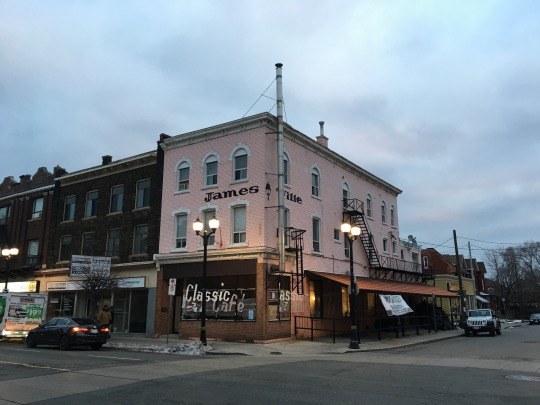
    Following this, we walked James Street North, which we were told has only really come up in the past 5 years or so. And alongside with this resurgence has come the slogan: Art is the new steel. This, of course, is responding to the fact that Hamilton is the steel capital of Canada, but that the industry is facing many challenges. I think it’s a neat slogan.

    imageimage

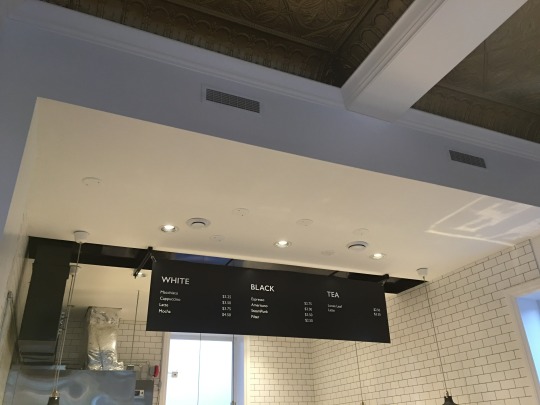
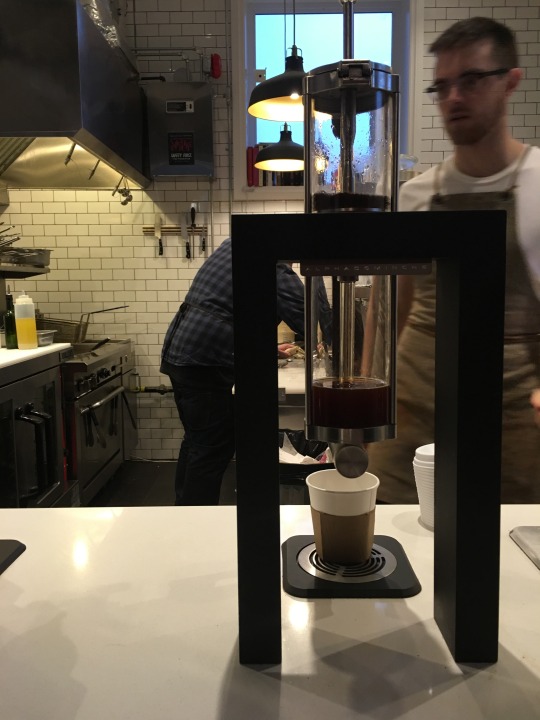
    On James Street we stopped in at Saint James Espresso Bar & Eatery, and it was everything we had hoped for and more. It was more because not only was it a cool space with great coffee, but they had some fancy thing called steam punk coffee.

    imageimage

    After James Street, we then drove around checking out some of the other areas in the city such as Kirkendall and neighboring Dundas.

    All in all, this afternoon was a great reminder that we are truly living in an urban century. It’s not just the Toronto’s, Berlin’s and Shanghai’s of the of the world that are laying down bike lanes, investing in art and culture, and generally reimagining their city centers. It’s also happening in smaller and mid-sized cities such as Hamilton. And that’s really exciting.

  • 5 random charts related to cities and real estate

    I was reading through PwC and ULI’s 2016 Emerging Trends in Real Estate report this evening and a handful of charts stood out to me. They’re not all related to each other, which is why this blog post is called what it is. But I think you’ll find them relevant to many of the things we talk about on this blog.

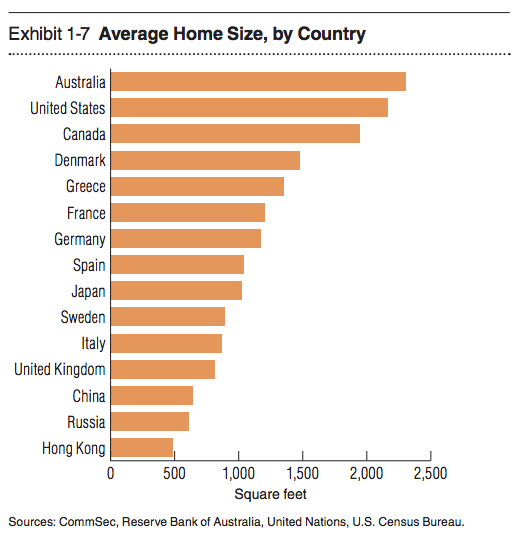
    1. Average home size by country

    With all the interest today in “small urban spaces” it’s interesting to see that the average home size for half the countries on this list is somewhere between 500 and ~1100 sf. It’s also amazing to see Hong Kong hovering just below 500 sf.

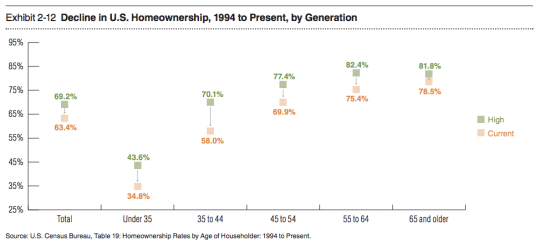
    2) The decline in homeownership in the US

    I like to follow home ownership rates because there’s a lot of debate around whether or not this obsession with homeownership – which has been so central to the ethos of countries like the US and Canada – is at all falling out of a favor. This chart shows some pretty significant drops from previous highs.

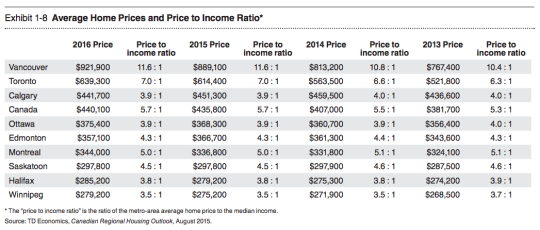
    3) Average home prices and the price to income ratio in major Canadian cities

    Not surprisingly, Vancouver and Toronto are the top of this list with the highest average home prices and the highest price to income ratios (i.e. the worst affordability).

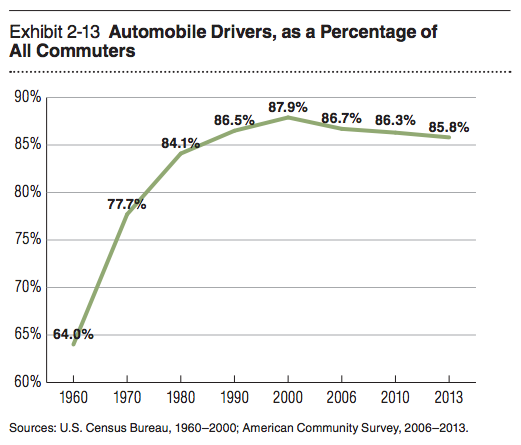
    4) Drivers as a percentage of all commuters in the US

    This chart is similar to what you would see if you looked at vehicle miles traveled. I’ve heard some people say that driving is now once again on the rise, but for the past decade and a half it’s been on a slow and steady decline.

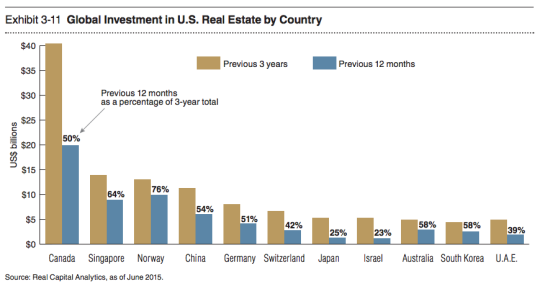
    5) Countries buying US real estate

    Canada is a big buyer of US real estate. But with the dollar where it is today, I am sure that number is headed downwards.

  • Our urban history in 50 buildings

    At the time of writing this post, it’s still 2015 – at least here in Toronto. But by the time you (subscribers) get this post in your inbox, it will be 2016. So happy new year! I am thrilled about getting this year started and I hope you feel the same way.

    To kick things off, I thought I would share a great interactive post from Guardian Cities called, A history of cities in 50 buildings. It’s a look at our urban history through 50 important and pivotal buildings. Buildings such as Southdale Center, which was the first fully enclosed, climate-controlled shopping mall, and Chicago’s Home Insurance Building, which was a building that really set the stage for the modern skyscraper that we know today.

    Not all of these buildings have left a positive legacy on our cities. I am sure that some of you would argue that the creation of the suburban shopping mall, with its corresponding “sea of parking”, was not a step forward for cities, but a step backwards. The architect behind Southdale Center, Victor Gruen, has even gone on record saying that he refuses “to pay alimony for those bastard developments.” He hated the shopping mall.

    But like them or not, these buildings are part of our urban history, and I think it’s not only interesting but important to understand their impacts. If you want to see which important buildings were missed, at least according to Guardian readers, click here. I have to say that I was happy to see both Montréal and Toronto represented in the original list, as well as a few other buildings that I’ve written about here.

    On that note, happy new year to you all, again, and many thanks for reading Architect This City. If you have any suggestions for content you would like to see on this blog in 2016, please leave it in the comment section below. This may be my personal blog, but my goal is to make it valuable for all of you. Hopefully I achieve that sometimes.

  • Yes, just do it

    Waves on a snow-sea by Jason  Hummel on 500px.com

    https://500px.com/embed.js

    I have started to meet with developers for my new book – becoming a real estate developer – and I can’t begin to tell you how impressive and inspiring it is to learn about their stories.

    It’s easy to look at someone who is successful and feel overwhelmed by everything they’ve accomplished. But nobody starts at the top of their game (unless maybe they were born with a silver spoon in their mouth). Usually there’s a backstory of sweat and struggle that rarely gets told. As the saying goes: success has many fathers, but failure is an orphan.

    But those are exactly the kinds of things I hope to uncover with this little project. I am less interested in the successes and more interested in the early decisions, struggles, and thoughts that went into making those successes even possible.

    And one thing I’ve noticed is a tendency to just go for it. In fact, when I asked one developer if he had any advice for young aspiring developers, he said: just fucking do it.

    As soon as he said this I couldn’t help but think of my elementary school English teacher who used always tell us the same thing – minus the expletive – whenever we’d ask him something such as, how long should this paper be, should we focus on this or that, and so on. He would always say: What does Nike say? Just do it. No buts. Just do it.

    At the time, I obviously didn’t give this much thought. But the fact of the matter is there’s so much value in doing. And it’s easy to overthink at the expense of doing. What he was teaching us was to have confidence in ourselves that we would figure it out along the way.

    The reason there appears to be a lot of interest in “how to be a real estate developer” is because there isn’t really a set path. You don’t go to school, apprentice for a year under the wing of a developer and then, boom, you’re a developer. 

    Most developers have carved their own paths. They just did it.

  • Understanding building areas is not as simple as it seems

    Understanding building areas is a fundamental component of real estate and development. But it can actually get surprisingly complicated. Definitions, naming conventions, and measurement techniques vary greatly around the world. 

    To some, “GLA” means gross leasable area. But to others, it means gross livable area. So it’s important to understand what exactly is being measured when someone tells you that that a building is X number of square feet. Are we talking gross building area, gross floor area, or rentable area? Does that number include the below-grade areas or just what is above-grade? To make matters even more complicated, there are nuances to consider depending on whether it’s a residential or commercial building. 

    By now, I am sure you’re starting to see how complicated something as seemingly simple as building areas can get. So let’s talk about some of the basics today. Again, definitions might vary depending on where in the world you area. They might even vary based on conventions you’ve adopted within your particular firm.

    Gross Building Area: Also referred to as Gross Construction Area by some, this is the total area of the building, measured to the outside walls without any deductions. As you’ll see later, some area definitions allow for certain deductions. Gross Building Area is important because it’s a big driver of your costs – specifically construction costs. This is how much building you’re building. But, and this is important, it does not drive your revenue. That comes later.

    Gross Floor Area: This is usually a specific locally-defined measurement convention. It often allows you to deduct certain areas from your gross building area, such as “major vertical penetrations” and below grade parking areas. This number doesn’t directly drive construction costs or revenue (saleable/rentable area), but it’s important because it’s what the city will use to determine important planning numbers such as the building’s density/floor space index and to calculate any applicable levies. It’s also a fairly public number and might be what the brokers are using to calculate, as one example, what certain land sold for on a per buildable square foot basis.

    Net Saleable/Rentable Area: This is a hugely important number because it directly drives revenue. It’s your top line. It’s the amount of space you can collect rent on or the amount of space that you can sell. And unless your revenue exceeds your costs (which you’ve calculated using the numbers above), you’re not going to be able to build. 

    Note: Commercial spaces (at least in this part of the world) often work a bit differently in that there is what is known as a gross-up factor. What that means is that tenants pay rent on portions of the common areas (such as corridors) that fall outside of what is known as their “usable area.” In this scenario, the rentable to usable area ratio (R/U) becomes important. Naturally tenants don’t like paying for a lot of space beyond their usable area.

    This is just a brief overview of building areas. A good architect will make sure that your building area calculations are meeting all local rules and conventions. But as a developer it’s important to know and understand what exactly is being measured and what the “loss factor” of your building is. In other words, how much space is being lost to areas that cannot be sold or rented? Typically, you want to minimize lost space, unless maybe you’re pushing some new concept.

    Anything to add to this building area summary? Do you use different terminology or conventions in your part of the world? Let us know in the comment section below. That would make for a fascinating discussion.

  • More than just a coffee shop

    image

    Today’s blog post is coming to you live from Quantum Coffee at the corner of King and Spadina in Toronto.

    I’m sitting by the window (where I keep running into friends) in a beautiful space that used to be an ugly youth hostel. Nice work Reflect Architecture and MAAST

    It’s my first time at Quantum, but I am so intrigued by all that is happening here that I feel compelled to share.

    So Quantum is a coffee shop. The americano I had this morning was quite good. I hope to have another one sometime in the future. But there’s more to this story. 

    Quantum is actually just one leg of something bigger. Attached to it – literally upstairs – is something called BrainStation. And across the street from it is something called The Konrad Group.

    The Konrad Group is a digital agency that does everything from brand strategy to mobile development. BrainStation teaches those same skills to other people via in-person courses in this recently renewed heritage space. And Quantum is the stimulant that helps fuel it all.

    The connective tissue between these 3 businesses, which are all basically owned by the same poeple, is something that I find super fascinating.

    It also feels like the intersection of design, technology, and space (real estate). And as many of you know, that’s what I’m all about.