Daily insights for city builders, delivered every morning at 6 AM ET. I’m Brandon Donnelly — a Toronto-based real estate developer and founder of Globizen. I’ve been writing here since 2013.

  • What’s with all the black houses?

    Author and professor Witold Rybczynski recently asked: “What’s with all the black houses that have appeared in recent years?” Black brick. Black paint. Blackened Timber. Lots of black.

    Alongside his post was an image of a “backcountry hut” by Leckie Studio Architecture + Design. I am adding a picture of the interior for completeness, but he only posted a picture of its exterior.


    Witold makes a great point about shadows, but when I read the post this morning I immediately thought to myself: Wow. What a beautiful cabin and what a beautiful setting.

    I like how the lighter carve out at the corner contrasts against the black. And because of this carve out, I assumed that the interior would have similar and lighter tones of wood. It does.

    At the same time, I thought of Urban Capital’s River City complex here in Toronto, which also features “black” as a prominent architectural expression. I am a big fan of these projects.

    So I guess it goes to show, once again, that beauty is really in the eye of the beholder.
  • How’s your PTAL these days?

    image

    As I was going through the new London Plan yesterday I noticed a number of references to PTAL. I didn’t know what this was, so I obviously had to look it up.

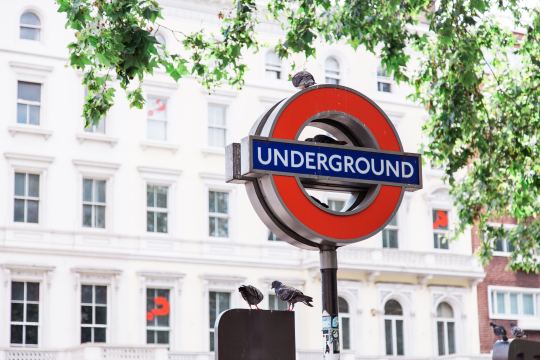
    It stands for Public Transit Accessibility Level. It’s a methodology that was developed in London in the 90′s. And it’s a measure of access to public transit, or of the density of the public transport network at any given location.

    There are 6 levels, though two of the levels are further subdivided into 2 sub-levels for greater precision:

    • 1a and 1b
    • 2
    • 3
    • 4
    • 5
    • 6a and 6b

    1 is bad. 6 is good. 

    What’s captured in this measure are the walking times from a particular location to the nearest transit access points; the reliability of the available services; the number of services available; and the average wait times.

    Historically, this measure has helped to determine how much density could be built on a particular site, how much parking should be provided, and so on. 

    For example, in the new London Plan, PTAL 5 and 6, as well as Inner London PTAL 4, are expected to see development with no residential parking. Once you move to PTAL 3, the parking maximum moves up to 0.25 spaces per unit. 

    In the draft London Plan you’re also supposed to use the highest existing or planned PTAL. So if transit improvements are planned for the area, you factor those into the calculation.

    Seems quite rationale (though it’s probably not a perfect measure of access and connectivity).

    If you’d like to determine the PTAL for a particular address in Greater London, you can do that here. Unfortunately, I don’t have a calculator for you if you happen to live outside of London. But there is one simple check you can do.

    The PTAL methodology assumes an average walking speed of 4.8 kph. The maximum allowable walk time for buses is 8 minutes and the maximum walk time for subway and light rail is 12 minutes. These numbers translate into distances of 640m and 960m, respectively.

    How far do you have to walk to access good transit?

    Photo by Bruno Martins on Unsplash

  • New London Plan released today

    A draft version of the new London Plan was released today for public consultation. It is “the spatial development strategy for Greater London”. And you can download all 524 pages of it, here. A final copy of the Plan is expected to be published by fall 2019.

    Here is what mayor Sadiq Khan had to say about the Plan (quote from The Guardian):

    “I am using all of the powers at my disposal to tackle the housing crisis head on, removing ineffective constraints on homebuilders so we make the most of precious land in our capital.”

    And that tone comes through in the document. Here is an excerpt from the “optimising housing density” policy section:

    “For London to accommodate growth in an inclusive and responsible way every new development needs to make the most efficient use of land. This will mean developing at densities above those of the surrounding area on most sites. The design of the development must optimise housing density.” (Section 3.6.1)

    The Plan also contains a set of clear performance indicators. They cover things like the supply of new homes, the supply of affordable homes, modal share in the capital, and so on.

    The ambition is 66,000 net additional homes each year. And by 2041, the goal is that 80% of all trips in London will be by foot, cycle, or public transport. There simply isn’t road the capacity.

    Which is why the plan also specifies parking maximums, as opposed to parking minimums. The Plan wants the starting point for any development that is well-connected to transit – or to future transit – to be “car-free”.

    If you have a chance, the new London Plan is worth a scan. Maybe you don’t want to print it though.

    Photo by Rob Bye on Unsplash

  • Stockholm’s congestion charge reduced car traffic by 20%

    Stockholm has a congestion charge that is used to reduce traffic volumes in the center of the city. Toronto does not. We looked at it, actually fairly recently, but then we lost our nerve.

    Stockholm’s congestion charge was first implemented on a trial basis starting in January 2006. Trials and pilots have become a common way to actually create positive change. Otherwise the status quo bias may simply be too strong.

    When Stockholm started the trial back in 2006, public support was very low. Maybe 30%. But as soon as it was implemented, car trips dropped overnight by 20%. Once people saw the benefits, support grew – hitting around 70% by 2011.

    Here is a brief Street Films video with Stockholm’s Director of Transport, Jonas Eliasson, talking about their experience with congestion pricing. If you can’t see the video below, click here.

    [vimeo 244771087 w=640 h=360]

  • An even longer view on home prices — this time in Amsterdam

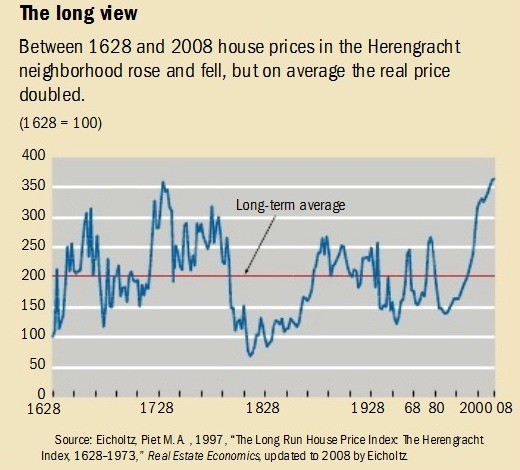
    In the comments of my recent post about Manhattan real estate prices during the Great Depression, a regular reader of this blog shared this terrific blog post (and corresponding research paper by Piet Eichholtz) about house prices along the Herengracht canal in Amsterdam from 1628 to 1973. Later it was updated to include up to 2008. It’s a long run house price index.

    Probably the first thing you’ll notice is that the index is highly volatile. Amsterdam enters its Golden Age, creates the world’s first stock exchange, and becomes the wealthiest city in the western world – house prices go way up. The tulip mania bubble pops – house prices go way down. It’s not until after World War II that prices sort of start to stabilize and increase, maybe, more consistently.

    In nominal dollars, the house price index increases 10x over the study period. But in real dollars most of that disappears. The biennial increase (that’s how the study was done) over the same period of time is just 0.5%. That translates into a doubling of house prices, which may seem quite good, except that remember it’s over a 380 year time period.

    image

    The Herengracht canal is a particularly good study because it was and has remained (or so I’m told) a desirable part of Amsterdam. This is an attempt to control for the variable that maybe some of the volatility could be explained by the area simply falling out of favor. (As a quick sidebar, the Herengracht was one of the first canals laid and dug out around the original city center of medieval Amsterdam during its Golden Age.)

    Generally, this finding is in line with one that economist Robert J. Shiller famously published a number of years ago where he argued that, when you correct for inflation, home prices actually look remarkably stable over long-run forecasts. In one study, he looked at 100 years of US home prices ending in 1990. Real home prices increased about 0.2% a year. What an outstanding hedge against inflation.

  • How technology might transform health care

    Below is an interesting podcast with venture capitalist Bill Gurley talking about how technology might transform and improve health care.

    Based on their discussion, the US spends about 17-18% of GDP on health care. In most Western European countries and in Canada, it’s about half of that.

    In Singapore, it’s only 4% of GDP and there doesn’t appear to be any demonstrable differences in terms of health outcomes.

    If you can’t see the podcast embedded below, click here.

    https://art19.com/shows/the-ezra-klein-show/episodes/5bef0efc-97ce-412b-89dc-cb5d9d476f6f/embed?theme=dark-blue

  • Manhattan real estate prices during the Great Depression

    image

    I was searching around trying to find data on long-term real estate prices and I came across a paper by Tom Nicholas and Anna Scherbina called, Real Estate Prices During the Roaring Twenties and the Great Depression.

    Here are some stats about Manhattan real estate (from the paper) that you all might find interesting:

    – In 1930, Manhattan housed 1.5% of the US population, but had approximately 4% of all US real estate wealth.

    – To construct their price indices the authors randomly collected 30 real estate transactions per month in Manhattan between 1920 and 1939. The mean price per square foot in 1929 was $6.91 (year of Black Tuesday). And the mean price per square foot in 1939 – 10 years later – was $2.29.

    – Buildings containing a store at grade tended to sell at higher prices. The authors speculate that this could be because a zoning change in 1916 made it difficult to open stores in “residential” areas.

    – Buildings with three, four and five storeys tended to sell at a discount. Six storeys or higher and the buildings generally had an elevator, which resulted in higher pricing.

    – Manhattan real estate prices reached their highest level in Q3-1929 before falling 67% by 1932. Prices remained more or less flat during the Great Depression.

    – If you bought a “typical property” in 1920, it would have retained only 56% of its value (in nominal dollars) by 1939. In fact, it took until 1960 for assessed property values in Manhattan to exceed their pre-Depression pricing.

    – An investment in the stock market index during this same time period, 1920-1939, would have outperformed real estate by a factor of 5.2x.

    Much of this probably seems hard to believe given the market today. Imagine waiting 40 years for the value of your property to come back.

    Photo by jesse orrico on Unsplash

  • Jeff Bezos’ regret minimization framework

    Who better to talk about on Black Friday than Amazon’s Jeff Bezos. Supposedly he’s now worth $100 billion.

    I just finished watching this short 60 Minutes clip about Amazon from 1999. If you can’t see it below, click here.

    [youtube https://www.youtube.com/watch?v=fjjUOemW-_Q?rel=0&w=560&h=315]

    Amazon was founded in 1994, so this was 5 years in. Already the company had gone public and had a market cap of somewhere around $30 billion.

    Now, keep in mind that this was right in the middle of the dot com bubble, but already Bezos was a billionaire on paper.

    What is clear from the above clip is just how obsessed Bezos was and is on the long game (”I don’t go in for carpe diem”) and on his customers. Here he is worth quite a bit, but driving around in a Honda Accord. 

    Bob Simons, the interviewer, pokes fun at him a few times for his reluctance to spend money. But Bezos says that it’s all about spending money on things that matter to customers and not spending money on the things that don’t.

    That’s customer obsession.

    P.S. The title of this post will make sense once you watch the video.

  • Beware of scam ICOs

    There’s certainly lots of buzz these days around the Blockchain and cryptocurrencies. 

    Some of it is negative. 

    Here is a recent New York Times article talking about how celebrity-endorsed “initial coin offerings” have created a new gold rush. Most of these ICOs are scams.

    But some of it is quite promising. 

    Here is a brief summary of how the Blockchain is being leveraged for the real estate industry. Many jurisdictions are already using it, or experimenting with it, for their land registries.

    I’ve been writing about Bitcoin sporadically since about 2013. But I really should spend more time getting deeper into this world. Many believe it will underpin the next wave of innovation in the tech space.

  • The worst on-time performance of any major transit system in the world

    I was recently with some New Yorkers and we got on to the topic of their subway system. I made a comment about how extensive their network is and how their express trains work so well for traveling further distances. 

    They responded by basically saying: “Yeah, it’s great, when it works.” They then went on to tell me that most of the time they just use Uber to get around the city because the subway has become so unreliable.

    Admittedly, I don’t use the NYC subway system enough to comment on its declining performance. But this recent New York Times article describes it as an utterly failing system.

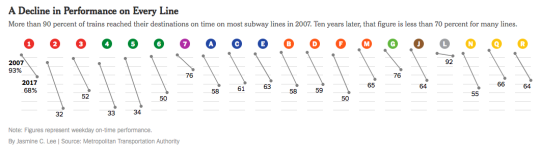
    Here is a diagram from the article that shows performance on every line (2007 to 2017), measured as a percentage of trains that reach their destinations on time (i.e. less than 5 minutes late):

    image

    In 2007, more than 90% of trains reached their destinations on time. Today, the weekday average is around 65% and some of the lines are in the 30s. This is the worst it has been since the 1970s when NYC was almost bankrupt.

    Apparently this also awards NYC’s subway the title of the worst on-time performance out of the world’s top 20 biggest systems.

    I suppose one of the lessons here is that subway lines on a map will always be far sexier than the nuts and bolts of maintenance, performance, and ridership. But we can’t forget the nuts and bolts. Maybe those are the most important parts.