Daily insights for city builders, delivered every morning at 6 AM ET. I’m Brandon Donnelly — a Toronto-based real estate developer and founder of Globizen. I’ve been writing here since 2013.

  • Canada got re-traded on the Gordie Howe bridge

    I’m trying to understand the new deal that was negotiated for the opening of the Gordie Howe International Bridge (scheduled for July 27, 2026) between Windsor and Detroit. The headlines read: “Tolls won’t be split with the US until the $6.4 billion of debt is repaid. Net revenues will be split with the US for 15 years.”

    As I understand it, the nuance is that the gross toll revenue won’t be split, but the net proceeds — after expenses like debt service, I hope — will be, for 15 years. This is different from the original deal, which had Canada keeping 100% of everything until it had paid off its $6.4 billion debt balance. Importantly, Canada also had complete authority over toll governance.

    This is objectively a worse deal for Canada and we were bullied into it at the last minute with a classic geopolitical re-trade. But how much worse is it?

    The public messaging is that net profits will likely be close to zero, and maybe even negative, in the early years of operations. So it’s not inconceivable that no payments will be made to the US’s local economic development fund until later years. If this is the case, the impact on Canada’s net present value might be negligible. I haven’t seen any of the math, but it’s possible this was a small price to pay to get the bridge open.

    From what I can glean, the most damaging aspects of this re-trade are the following: first, Canada lost sole authority to set its own tolls and govern the bridge — a bridge that we paid for in full! And second, it demonstrates that, at the present time, the US cannot be trusted to honour its agreements.

    Re-trading, of course, happens all the time in politics and business, and the real estate industry is no different. But I would say that there’s a difference between a bad-faith re-trade and a legitimate risk adjustment. Sometimes new information is discovered or the market changes in the middle of a deal, and one party needs a deal adjustment to be able to proceed.

    At the same time, there are also bad-faith re-trades where one party simply wants to apply any leverage it may have, be a bully, and capitalize on deal fatigue. “Ugh, let’s just get this open!” This is a short-sighted practice because it immediately destroys trust and damages your reputation. It may leave you better off on this one deal, but it makes the next ones that much harder.


    Cover photo by Brad Switzer
  • The last-in first-out rule of real estate land

    During development downturns, at least two things tend to be true.

    One, land on the periphery tends to get hit first and recover last. It’s a kind of “last in, first out” principle. During a market expansion, core areas become expensive first, and then demand “spills over” to the periphery in search of opportunity.

    These areas are, therefore, last (or later) to appreciate and first to fall when the market turns. This also means that they’re last to rebound when the market recovers because, generally speaking, demand will start in the core and then move outward.

    And two, execution becomes critical. If you don’t get your product offering right and execute well, you can’t rely on the tide of the market to carry you. We’re seeing exactly this today.

    It is, as we talk about on this blog, extremely difficult to make new projects work in the current market environment, and so few developers are launching and breaking ground, and many projects are getting cancelled.

    But it’s worth pointing out that there are still some projects moving forward, and that’s because they got their product offering right and they executed well. And maybe they leveraged public grants or incentives to help tip the scales of feasibility.


    Cover photo by Ali Köse

  • When old deals come back at new prices

    This has happened to us on more than a few occasions this year. Development sites that we offered on years ago have come back around to us at significantly lower prices. The obvious first thought is, “Shit, good thing we didn’t buy!” At the same time, there’s a reason we didn’t. Typically, it’s because we were trying to make the deal work with a delayed close upon construction commencement, a VTB, or some other form of structure. We didn’t budge on what we needed, and so we didn’t get to a deal.

    When a deal does come back around, it’s interesting to revisit our original pro forma assumptions to see how we did and how our thinking may have evolved. In today’s market, it’s not uncommon for our base rental rates to be even lower than what we were assuming a few years ago. Are we now at the bottom? Only time will tell.

    The paradox of today’s market is that land prices are the lowest they have been since I started in development, but it’s exceptionally difficult to make new projects work. Of course, as soon as it becomes easier to make projects work, land prices will once again reflect that. So if you are looking for opportunities, today’s market is about finding ways to capitalize on cheaper land while protecting for the risks inherent in the current market.

    In other words, you need to be a contrarian. And as we know, if you’re a contrarian and you’re right, there’s a huge upside. But if you’re a contrarian and you get it wrong, well, then at least you went for it! The ideal scenario is that you simply get the timing right, but that involves luck. The things you can directly control are looking at a lot of opportunities, being disciplined in your underwriting, manufacturing structures that reduce risk, and generally being creative.


    Cover photo by Teuku Fadhil

  • What do homebuyers and tenants actually want?

    Since about the mid-2000s, planning policies in the Greater Toronto and Hamilton Area have favoured higher-density development in already built-up areas, instead of on greenfield lands. The objective was to curb urban sprawl, use our already developed lands more efficiently, minimize our environmental footprint, and encourage a built form that is conducive to non-car forms of mobility.

    As an urbanist and promoter of walkable, transit-oriented communities, I applaud this approach. Toronto is far from full. But I also recognize that this has restricted housing supply and shifted the market toward housing types that cost more to deliver for homebuyers and tenants. Reinforced-concrete buildings are more expensive to construct than wood-framed houses in the suburbs. The most affordable housing markets tend to have highly elastic supply.

    A recent report by Frank Clayton for the C.D. Howe Institute agrees. Planning policies in the Greater Toronto and Hamilton Area have become disconnected from consumer preferences, limiting the kind of housing supply that people want the most: grade-related housing. The proposed solution is to increase the supply of serviced greenfield land, reduce the barriers to development, and diversify the housing types built in our traditional suburban subdivisions.

    I think this is an important topic, and I have two immediate thoughts.

    Firstly, is it really true that Canadians and residents in the GTHA have an overwhelming preference for grade-related housing? The 50 people who responded to my Twitter poll seem to generally think so, but as I have argued many times before on this blog, I think it’s hard to know exactly right now. There could be a large segment of households who might prefer to live in a mid-rise courtyard building with a large private green space in the middle and lots of ground-floor amenities. Until this becomes an available housing option, we won’t really know.

    Secondly, unlocking additional greenfield land does very little to change the market forces playing out within our existing urban areas. The Toronto CMA lost about 77,500 people last year to domestic outmigration, presumably because they found greater economic opportunity and/or more affordable housing elsewhere. At the same time, 92% of the housing starts in the City of Toronto in 2025 were apartments. This is not because we’re holding back greenfield land within the city proper boundaries, it’s because intensification is the only option left.

    The broader CMA is a different story. Only about a third of its land area is physically urbanized. The remaining two-thirds is heavily restricted by environmental protections, which is precisely where Clayton sees opportunity for more grade-related housing. “Housing policy cannot succeed if it ignores consumer demand,” says Clayton. “Canadians continue to aspire to ground-related homes. Planning for the housing people want, rather than simply counting units, is key to restoring affordability.”

    I’m all for giving housing consumers as much choice as possible. Not everyone would prefer a Parisian apartment to a house in the suburbs (which is what the algorithms will tell you about me). But let’s not forget that we have yet to solve this problem: How do we create attainable family-friendly housing at scale in our existing urban areas and reorient the city toward a post-car future? Toronto is now an apartment city and this is only going to become even truer, regardless of what happens on the periphery.

    Change is starting to happen with our new major street and multiplex policies, which can be a form of grade-related housing. This typology is just denser, often has no parking, and is delivered in an urban, transit-supportive format rather than a car-dependent subdivision. To argue that “planning policies have missed the mark” is not wrong, but we’ve also been missing the mark by not building enough of what people may want within our urban areas.


    Cover photo by Dillon Kydd

  • Why the office market will eventually rise again

    July 13, 2026 · View original


    Real estate development is cyclical. Supply adjusts slowly to demand, and so it’s common for developers to get ahead of their skis and build too much space. This is what happened in the 1980s when American developers built more office space than in all previous years of the republic’s history (yes, it’s true), and then nationwide vacancy rates went from 4.6% to 16.9%. And it’s what happened following the dot-com crash when office vacancy in Silicon Valley went from almost 0% to over 20%.

    Today, things feel kind of similar.

    According to Cushman & Wakefield, nearly 37% of the office space in downtown Seattle is now vacant. Since 2020, it is estimated that these office properties have in aggregate lost about $15 billion, or almost half, of their value. This has people repeating the regular refrain that “this time is different” and that “the office market may never come back.” And indeed, the commonly held belief is that this time isn’t just cyclical, it’s also structural. How and where we work has changed.

    But unless you believe that offices as a spatial construct will fully cease to exist at some indeterminate point in the future, then the reality is that the demand curve has simply shifted. We may not need office space in quite the same way, but we will still need some office space. This means that, at some point, we will find a new supply-and-demand equilibrium and, at some point, developers will get back to building, and overbuilding, office buildings. It’s just impossible to determine when that might be.


    Cover photo by Zhifei Zhou

  • Toronto is now an apartment city

    July 12, 2026 · View original


    The way CMHC typically tracks and categorizes housing types is as follows: single, semi-detached, traditional row, and then everything else. This “everything else” bucket is called “apartment,” and it includes high-rise apartments, mid-rise apartments, low-rise apartments, duplexes, triplexes, multiplexes, and anything else that doesn’t fit into one of the other categories.

    This taxonomy reflects our bias toward single-family, grade-related housing because if you look at the distribution for a city like Toronto, it doesn’t really make sense to do it in this way. For example, if we were to look at housing starts in Toronto proper for 2025, the distribution looks like this:

    – Single: 5.2% – Semi-Detached: 0.4% – Row: 2.5% – Apartment: 92%

    If we were to look at the entire Toronto CMA, the distribution updates to the following:

    – Single: 12% – Semi-Detached: 0.5% – Row: 14.2% – Apartment: 72.8%

    Do we really need a separate category for semi-detached houses? And would it not make sense to get a bit more granular with the apartment category given that it’s basically what we’re building these days? Obviously, markets vary, but in the case of Toronto, we have flipped to an apartment city.

    Now, if you were to look at an aerial view of the Toronto CMA, you would see the opposite. You would see concentrations of towers surrounded by seas of low-rise housing, and you would be forgiven for thinking differently about the city. But this is a lagging indicator. The leading indicator is housing starts, and it’s pretty clear what that is saying.

    These are important stats to think about because they help illustrate the housing problem that needs to be solved. Last year, Toronto saw a net domestic out-migration of 77,500 people. One possible explanation is that some of these people left for more affordable, single-family housing. For the sake of argument, let’s assume that’s the case.

    A portion of this segment may only be interested in single-family housing, and if that is the case, Toronto will never again create the housing they want at scale. But I would wager that there’s another meaningful segment that would have stayed in Toronto if only they could have found housing that met their needs. And that is the opportunity that exists today for city builders.

    We know that apartments are the future of Toronto, but we also know that they can take many forms, from 100-storey towers to small “missing middle” projects that are still grade-related. The housing solutions we seek are necessarily going to lie within the black box we today call “apartments.”


    Cover photo by Venrick Azcueta

  • Architecture for today

    July 11, 2026 · View original


    Periodically, Twitter will surface posts for me that bemoan modern architecture and advocate for good old-fashioned traditional architecture. Sometimes these posts will share a modern building with a disparaging comment like, “Imagine wanting this over traditional architecture,” and sometimes I will engage because, yeah, I would prefer the modernist building to traditional architecture.

    But let’s be clear: I don’t have an issue with traditional architecture done well, and there are also countless examples of “modern” architecture that I think are truly abysmal. This is not about architectural tribalism. I love Paris and think it is beautiful, but I also think Brazil’s equatorial brutalism is equally beautiful. Both feel authentic.

    Here’s how I would describe my position.

    First, focusing on one style or another is not the goal. Many contemporary architects think of “style” as a bad word. It implies a superficial veneer. Great architecture aims to be something deeper and more intentional. It solves problems, responds to specific conditions, and also presents new ideas.

    Second, the beauty of art, architecture, and design is that they are never created in a vacuum. They always reflect the current cultural environment. The challenge I have with traditional architecture is that I find it curious to try to speak to a moment in time that no longer exists. I am much more interested in authenticity and what the future might bring.

    And third, movements take time. It’s easy to romanticize the past as being better than our current environment. Whether we’re talking about Impressionist painters or architecture free of ornament (in the case of modernism), it is intellectually easier to think the old ways were better. But history has shown us that posterity will almost certainly come to see things differently.


    Cover photo by laura adai

  • The real story behind Toronto’s stalled population growth

    July 10, 2026 · View original


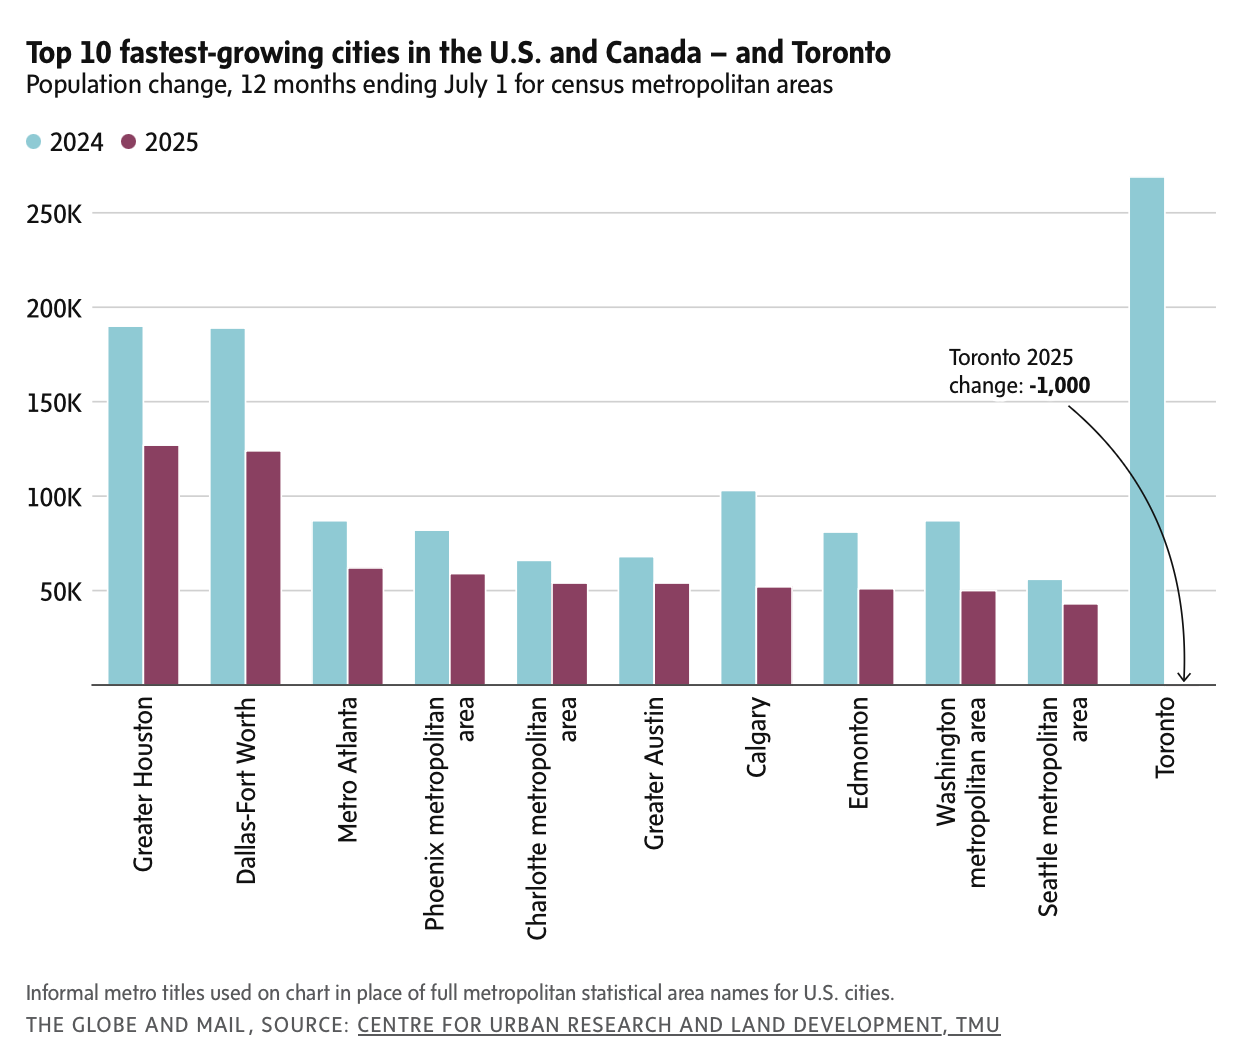
    How quickly things can change. In 2024, the Toronto Census Metropolitan Area was the fastest-growing region in Canada and the US. Then, last year, it lost around 1,000 people and dropped to 443rd place. See above chart. The obvious explanation is Canada’s concerted effort to reduce temporary workers and international students. But actually, Toronto is still one of the top regions when it comes to net international migration, adding 53,000 people in 2025. The real story, according to recent analysis from the Centre for Urban Research and Land Development at TMU, is that Toronto has simply gotten too expensive, driving massive domestic out-migration. Last year, Toronto lost 77,500 people this way, wiping out its natural growth and its net international migration gains. This is our regular reminder that we need to be far better at delivering attainable housing at scale.


    Cover photo by Frank Huang

    Chart from The Globe and Mail

  • How public transit connects the World Cup host cities

    July 9, 2026 · View original


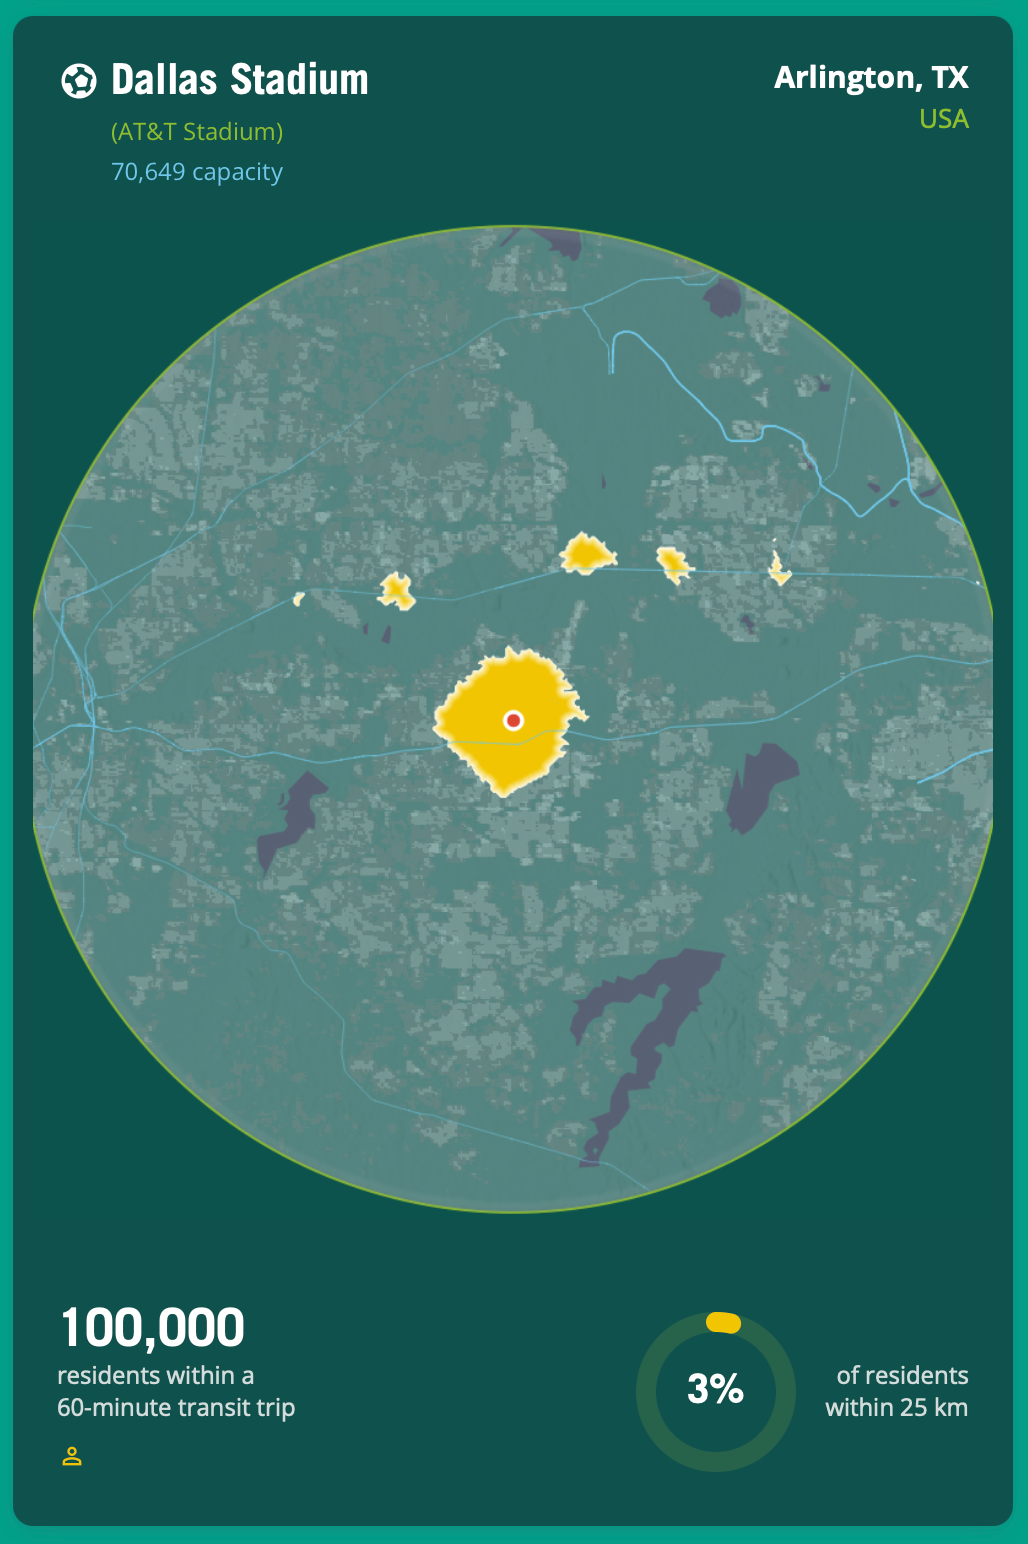
    The 2026 FIFA World Cup is being hosted across 16 different cities in Canada, the United States, and Mexico. The city hosting the most games is Dallas, with 9 matches. Supposedly, this is because the city has a nice stadium with a retractable roof and capacity for 70,649 people, and Dallas is a fairly central location for a tournament being hosted across North America.

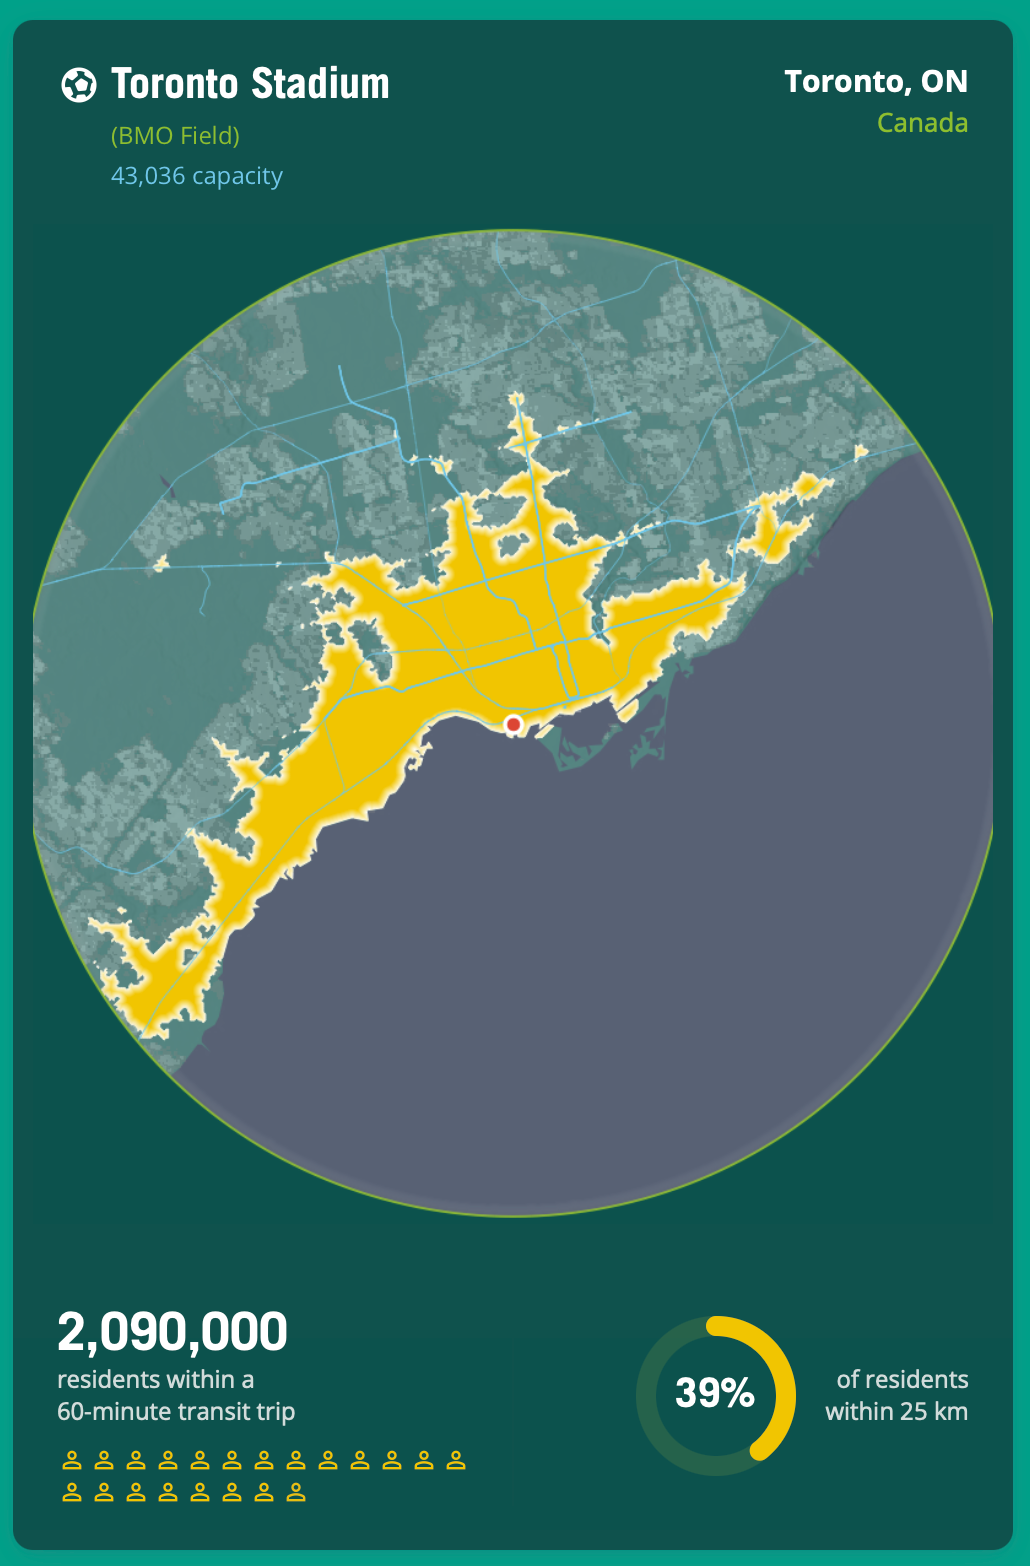
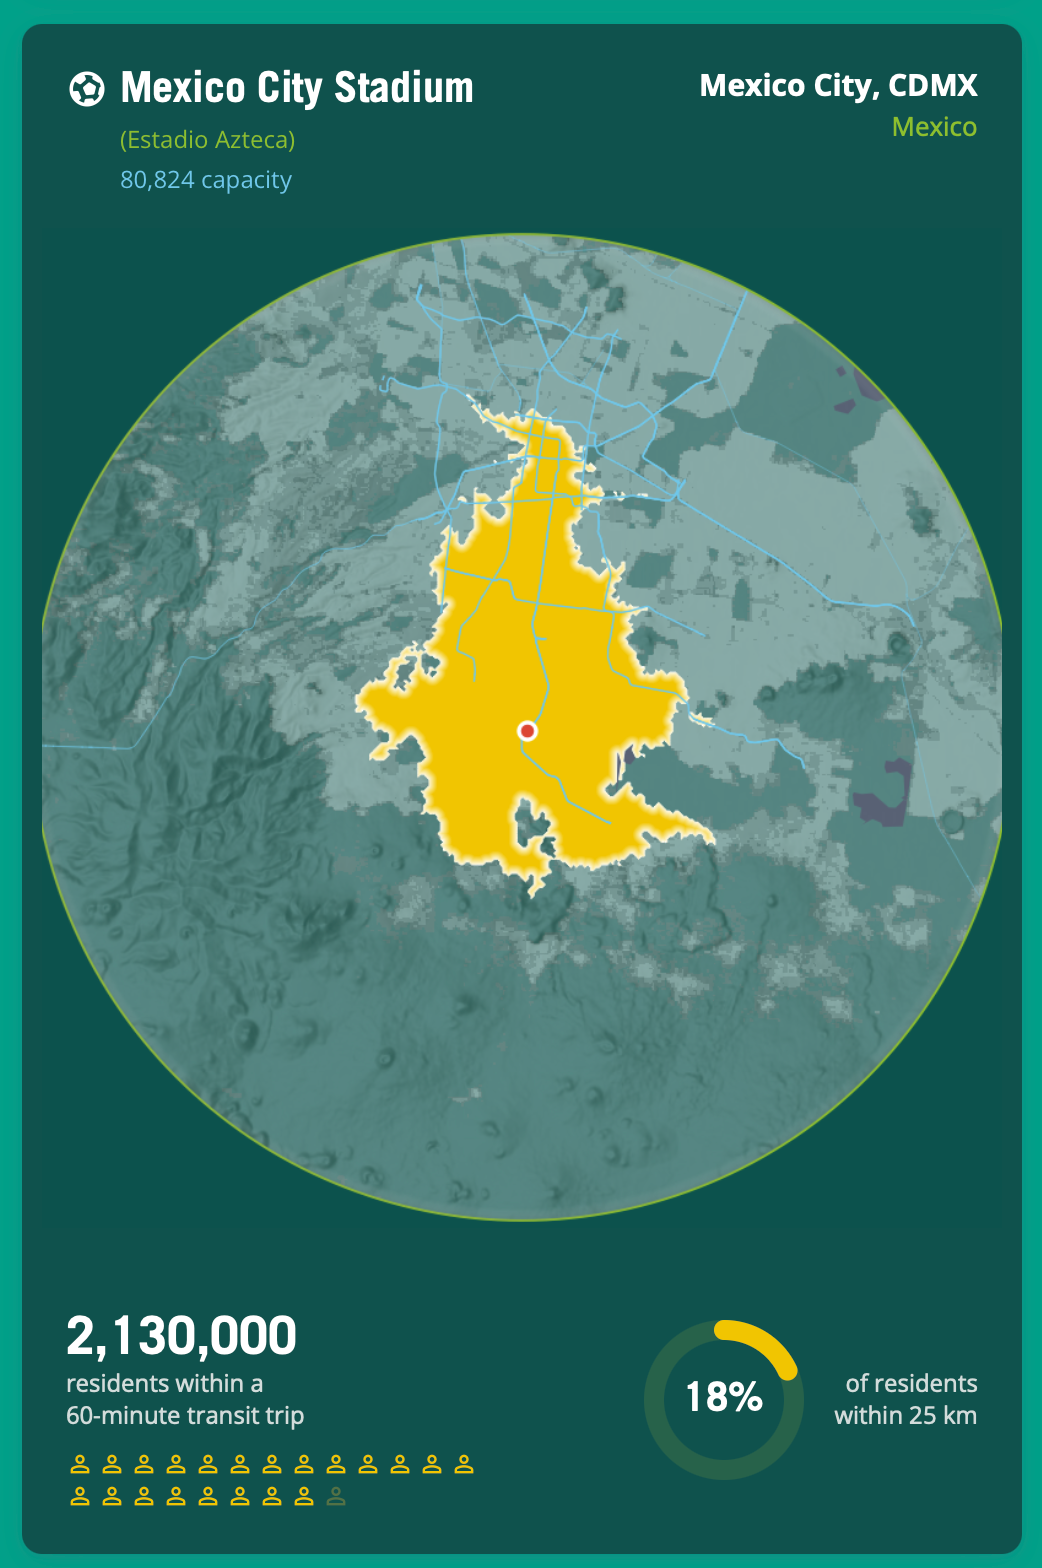
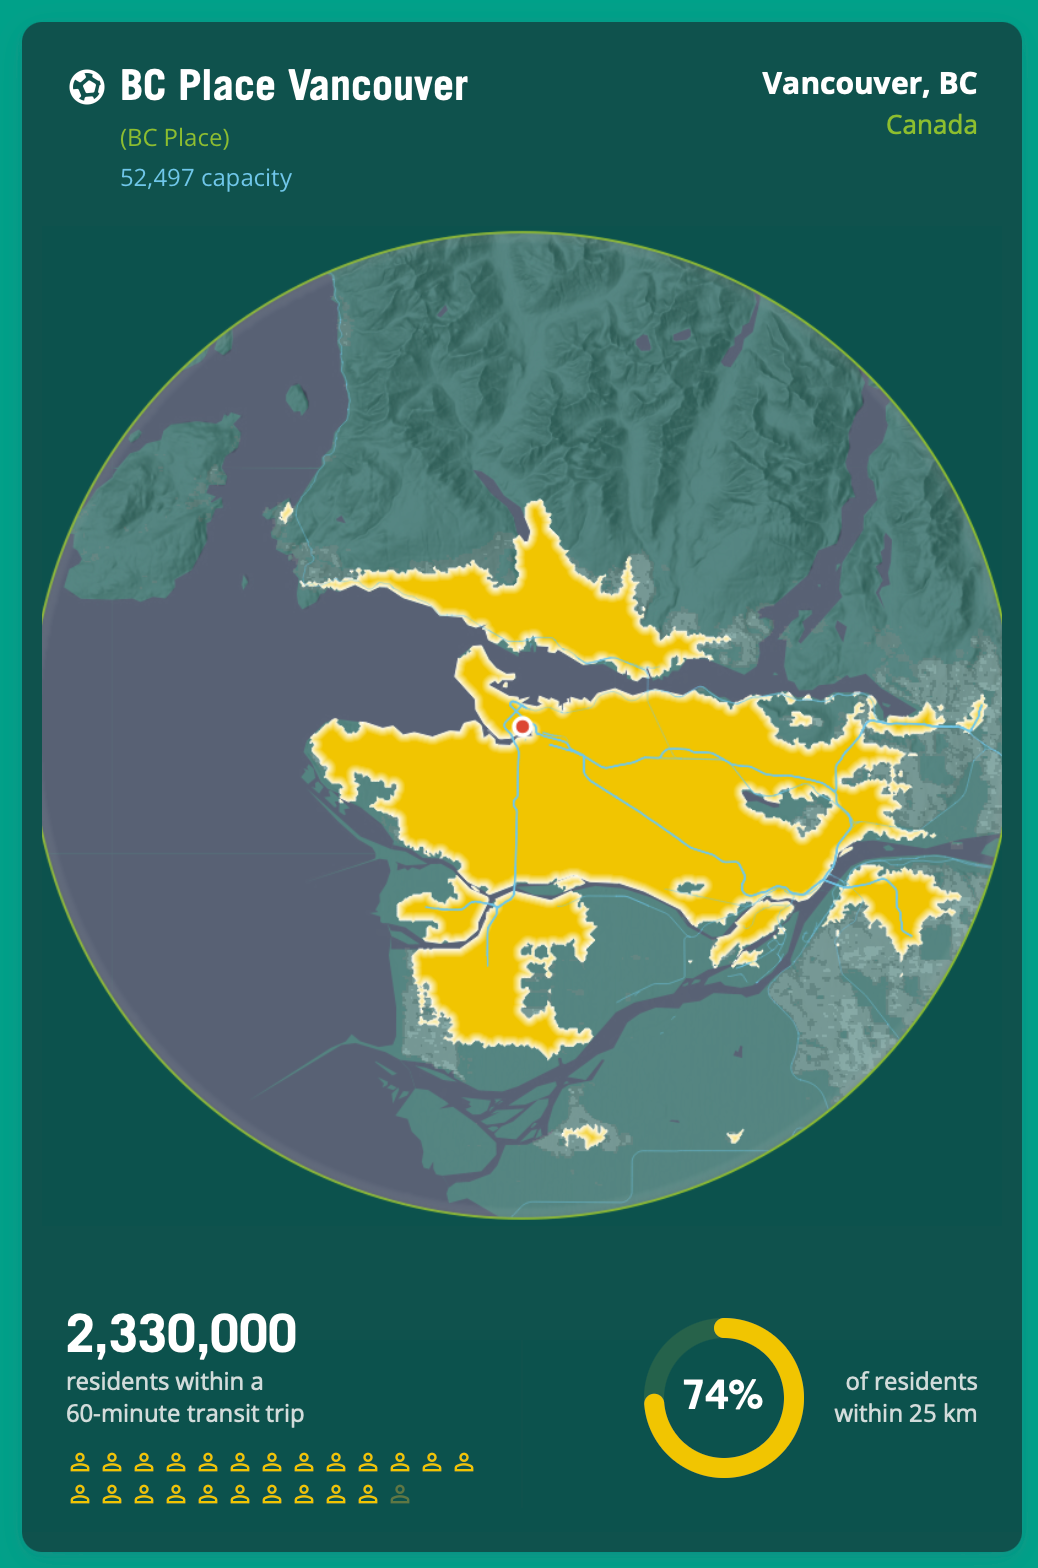
    But here’s another way of looking at the stadiums. The School of Cities at the University of Toronto recently published a study called “Transit-Oriented Stadiums.” What they did was look at how well connected each stadium is to its host city by public transit. More specifically, they looked at how many people live within a 60-minute public transit isochrone polygon.

    Dallas Stadium (AT&T Stadium) is in Arlington, Texas, and it has about 100,000 residents within a 60-minute transit trip:

    Now, here’s Toronto. BMO Field has a much smaller capacity (43,036 people), but over 2 million residents live within a 60-minute transit trip:

    Mexico City’s transit catchment reaches over 2.1 million people, despite its stadium being out of the core of the city:

    And Vancouver takes the top spot with over 2.3 million people:

    These diagrams highlight a striking divide in land-use patterns. The two key factors are stadium placement and transit investment. Obviously, if you flipped the script and mapped the number of residents within a 60-minute drive, then Dallas Stadium would perform quite differently. But bringing 70,000 people to one location via cars will never match the spatial efficiency of public transit.


    Cover photo by Ronin

    Diagrams from the School of Cities at the University of Toronto

  • The liveability rankings are shifting toward Asia

    July 8, 2026 · View original


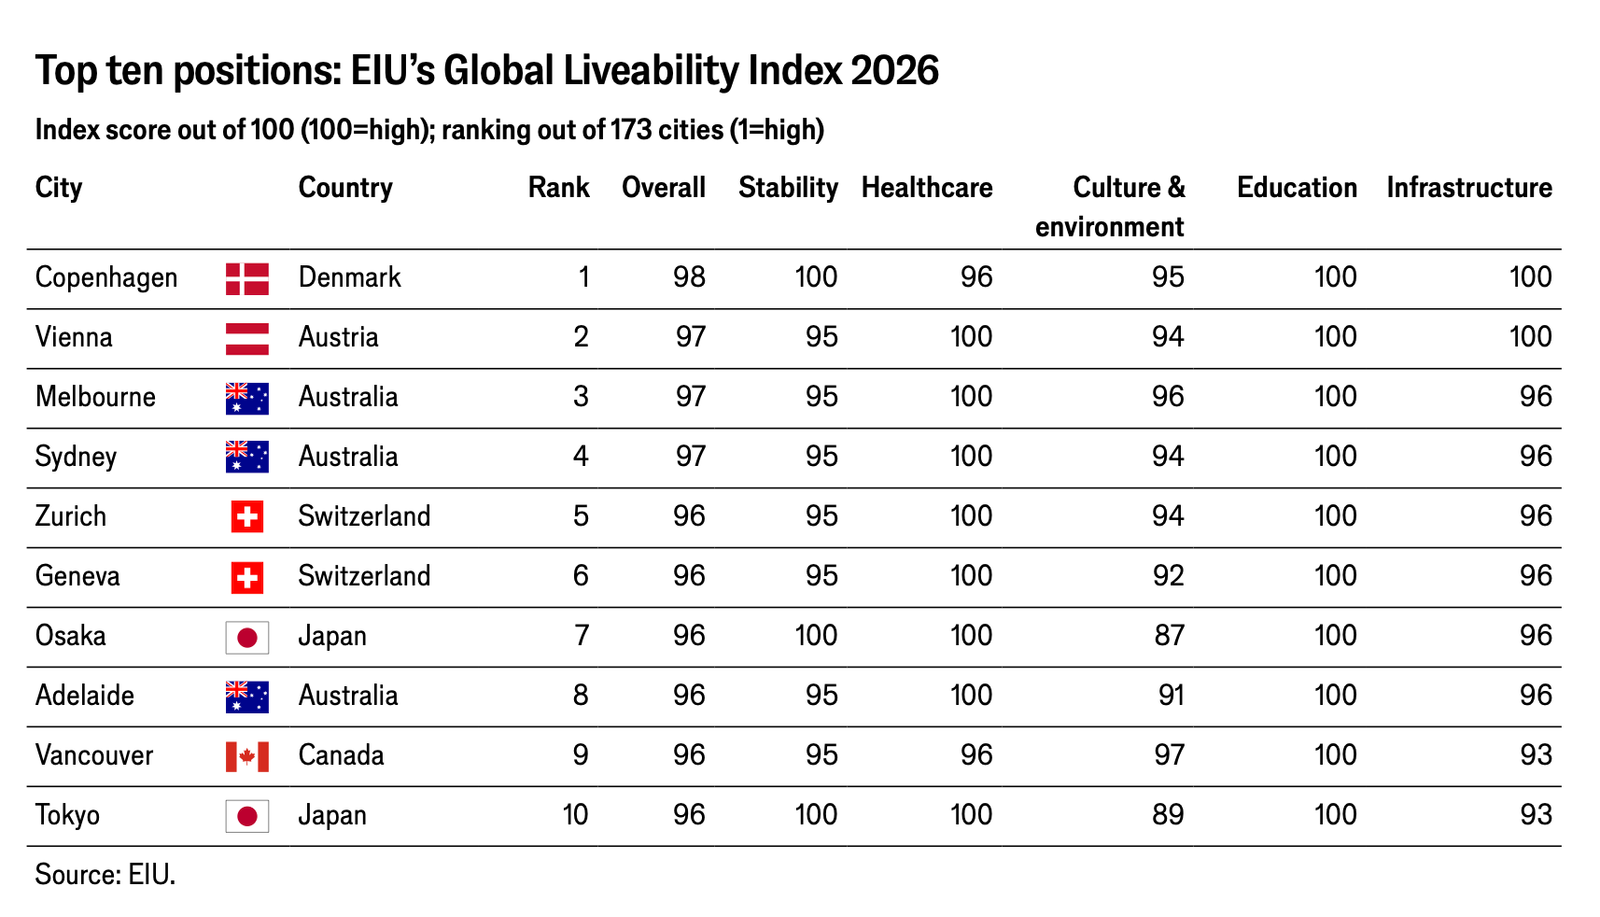
    The Economist just released its list of the world’s most — and least — liveable cities in 2026. It has a somewhat similar complexion to Monocle’s quality of life survey in that you’ll find cities like Copenhagen, Vienna, Sydney, Zurich, and Vancouver on both. But at the same time, there is a core difference.

    Basically the way it works is that The Economist’s ranking is designed to help HR departments calculate “hardship allowances” when staff are relocating overseas, whereas the Monocle survey places a much greater emphasis on questions like: Can I grab a drink at a cool bar at 2 AM on a Tuesday? It’s for this reason that you won’t find cities like Lisbon, Paris, and Madrid on The Economist’s top 10 list.

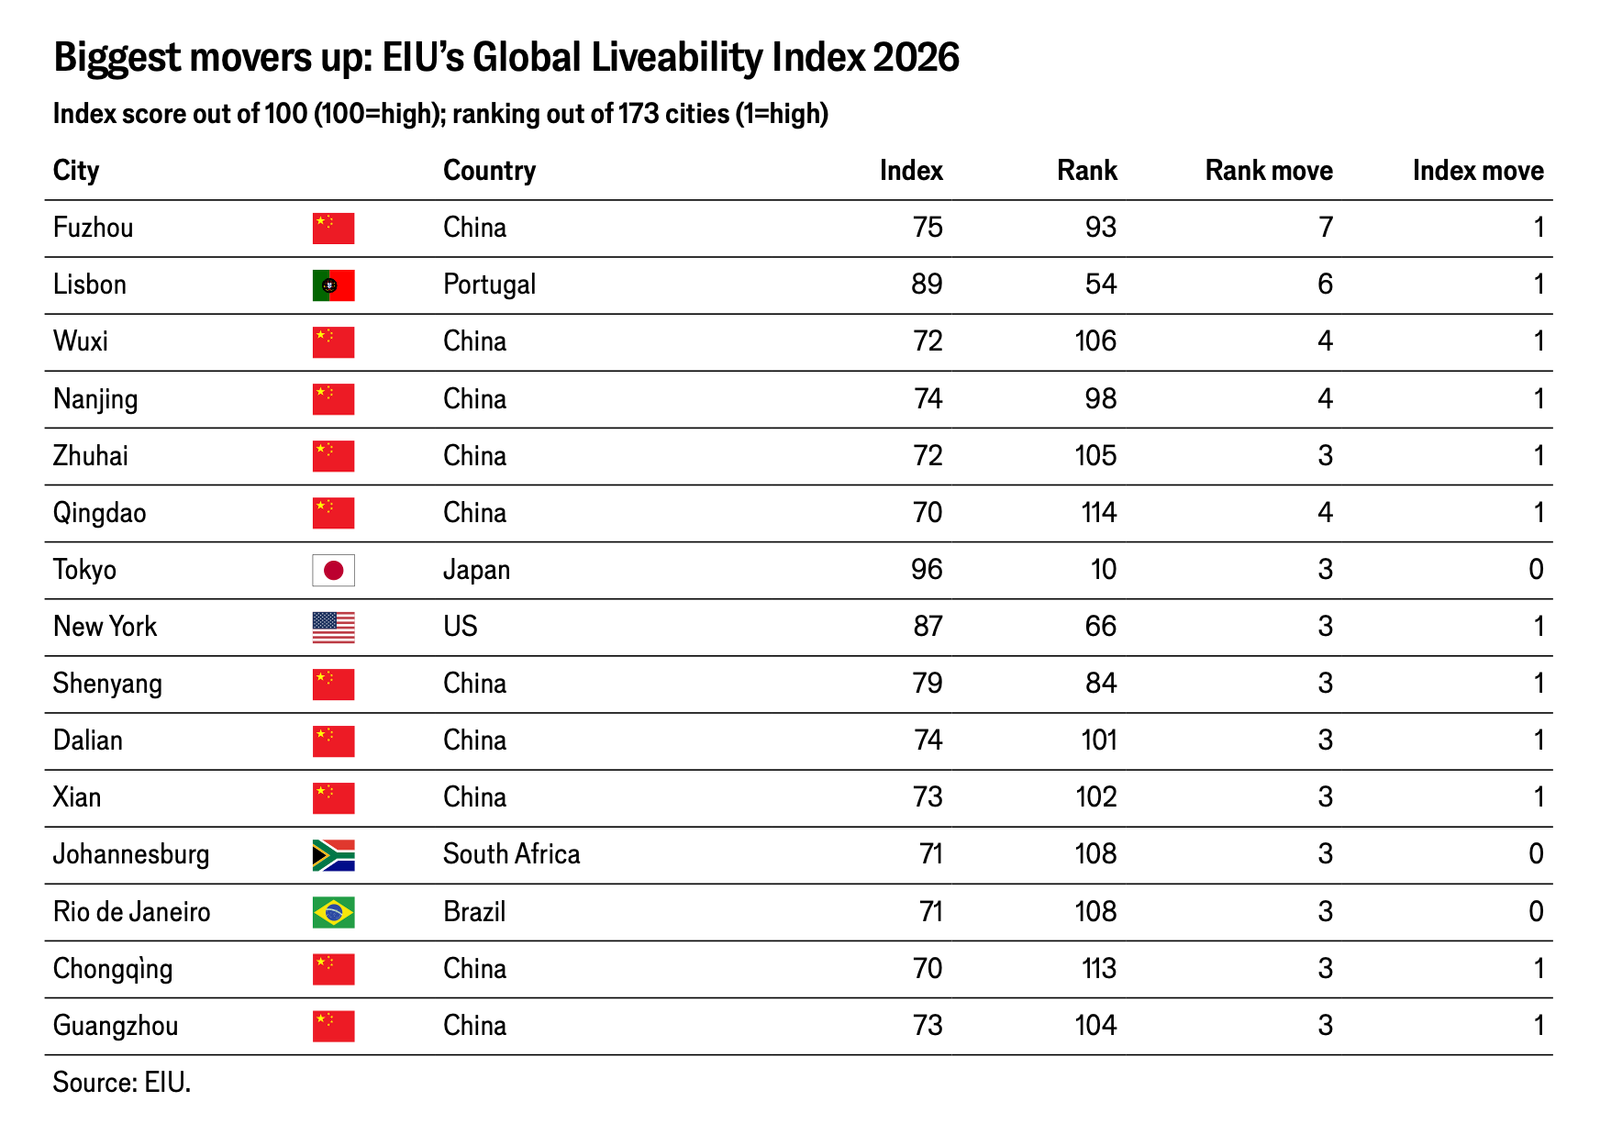
    The other not-very-surprising fact of this year’s ranking is that cities in the Middle East and North Africa (MENA) broadly saw the largest declines in liveability. This is due to the Iran war and deteriorating “stability” points.

    Perhaps the most interesting takeaway is the rise of Asia, and in particular China. There are now 9 Asian cities in the top 20, compared to 7 cities in Europe. According to The Economist, improvements in healthcare are why Chinese cities are posting the biggest gains. Also on the movers-up list is New York, due to falling crime rates and a reduced perceived terrorism risk.

    While this is certainly positive, if you’d like to dive deeper, you can download a full copy of the EIU Global Liveability Index 2026.


    Cover photo by Julius Carmine