Daily insights for city builders, delivered every morning at 6 AM ET. I’m Brandon Donnelly — a Toronto-based real estate developer and founder of Globizen. I’ve been writing here since 2013.

  • Human Development Index

    The Human Development Index (HDI) is a composite index that ranks countries based on four key indicators (3 dimensions):

    • Life expectancy in years (health)
    • Expected years of schooling (education)
    • Mean years of schooling (education)
    • Gross national income per capita (standard of living)

    Equal weighting (1/3) is given to each of the above dimensions: (1) health, (2) education, and (3) standard of living.

    And the resulting index value is a normalized number between 0 and 1, with the latter number representing the maximum possible value.

    Generally speaking, a country is thought to be developed or advanced when it has an HDI greater than 0.8.

    The way you calculate each dimension’s index value is by using the minimum and maximum limits set out by the United Nations.

    To give you an example, for gross national income per capita (standard of living), the minimum is $100 and the maximum is $75,000. (Logic behind these numbers, here.)

    Once you know the boundaries, you then use this formula for each dimension:

    Dimension Index = (Actual Value – Minimum Value) / (Maximum Value – Minimum Value)

    Each of the individual dimension indices are then aggregated together to create that country’s HDI.

    In 2017, the country with the highest HDI was Norway at 0.953. Brazil, which is what got me started thinking about this, was at 0.759. So not quite developed.

    Canada and the US were on top of each other at 0.926 and 0.924, respectively.
  • Merry Christmas

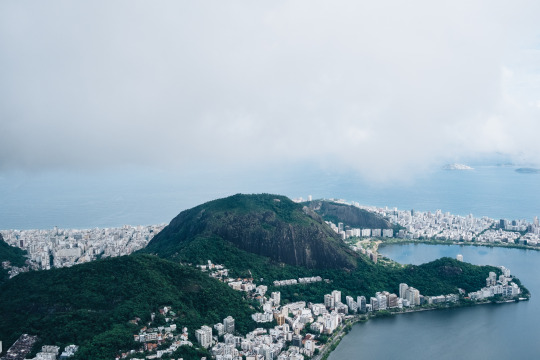
    Merry Christmas from Rio de Janeiro. 

    Even though I am still practicing my daily blogging ritual, this is about the only time of the year where I find it’s possible to “disconnect” a little. So hopefully you’re doing a bit of that yourself and spending time with family and friends, regardless of whether you celebrate Christmas or not.

    The above photo was taken from the feet of the Christ the Redeemer statue at the top of Corcovado mountain. Excluding its base, which is about 8m tall, the statue itself is 30m in height. That’s basically the same height as Junction House (a 9 storey midrise condominium).

  • Unfinished: The Museum of Image & Sound

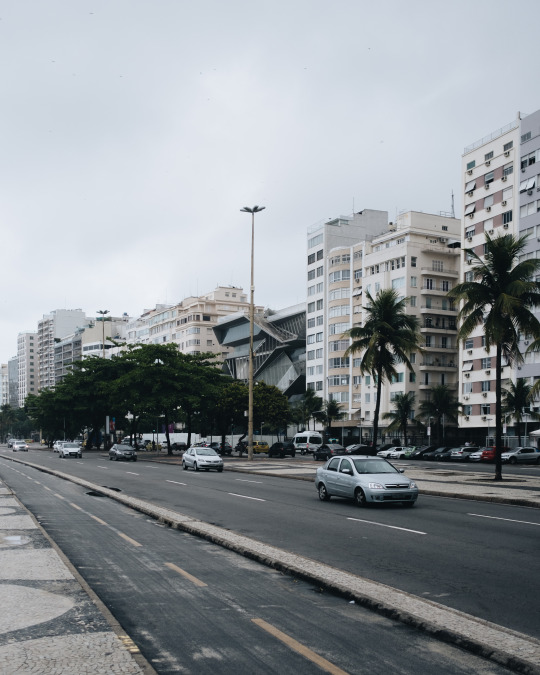
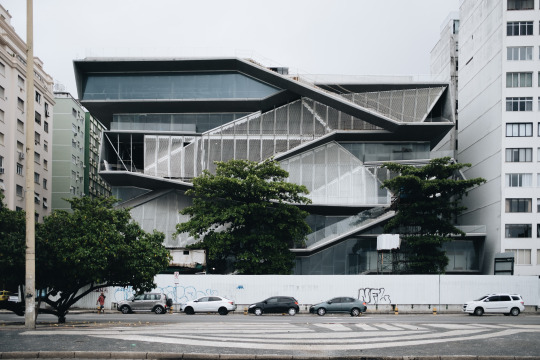
    Here are two images of the unfinished Museum of Image & Sound in Rio de Janeiro by Diller Scofidio + Renfro.

    imageimage

    The building sits across from Copacabana’s famed beach and tiled boardwalk. The street you’re looking at is Avenida Atlântica.

    The idea behind the architecture was to create a kind of “vertical boulevard” on the building’s beachside facade. Clever.

    It is particularly impactful when you see it within the context of Copacabana’s delightfully formidable streetwall and curving promenade.

    But it is unclear when the building will ultimately be finished. Construction started in 2010 and it first stalled in 2012. Too bad.

  • Oi Rio

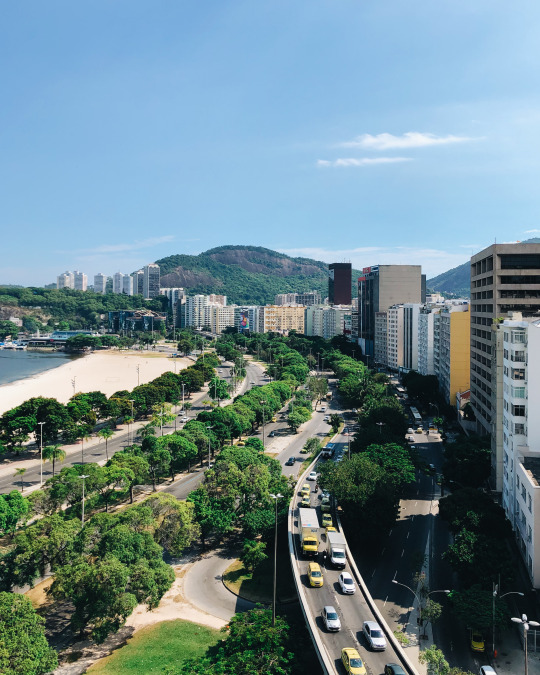
    I just arrived in Rio de Janeiro, which is where I’ll be for the next ten days. Here is a photo looking south from the rooftop of our hotel (more photos to follow on Instagram):

    image

    Today was a fairly relaxed day after many hours of travel. But tomorrow the architecture and design tour begins. 

    I am still trying to get a feel for the city. The first thing people tell you after you arrive is to be careful. Don’t go out at night. And take Ubers. 

    Uber is a significant advantage in a place like Rio where few people seem to speak English and you may be concerned about somebody taking you for a ride.

    Not only was the Uber from GIG about R$80 less expensive than a taxi (I was probably quoted the gringo rate), but you also get perfect information in terms of where you are going.

    This emphasis on safety and security is, of course, highly evident as you walk around the city. Lots of gates and lots of cameras.

    It’s perhaps a bit ironic to see so many places sealed off from the outside when you consider how great the climate is and how friendly the people are.

  • Maple Valley? No.

    At this time of year, I am always amazed by the number of mass emails that I receive from unknown people and companies. They have my email address, clearly, and yet I only receive one email a year from them – a happy holidays email. I am not opposed to holiday cheer. I love Christmas. But if you’re looking to build any sort of meaningful rapport with an audience, my sense is that you ought to send more than one email a year.

    In other news, the Economist published an article this past week talking about how Toronto is attracting disaffected (Indian) tech workers from the US and, more particularly, Silicon Valley. It is largely a story of immigration and diversity. But at the end of it, the Economist also reports that some people are now calling Toronto, Maple Valley. Toronto immediately reacted to this moniker – negatively.

    Nobody refers to Toronto as Maple Valley. And these sorts of names are stupid. In the 1990s, the Flatiron District in Manhattan started being called Silicon Alley (at least by some). That name was also stupid. New York is New York. And Toronto is Toronto. If you’re going to assign a nickname, it should not be derivative. And in the case of Toronto, you probably also want to avoid kitschy Canadian stereotypes.

  • US cities with the highest construction costs

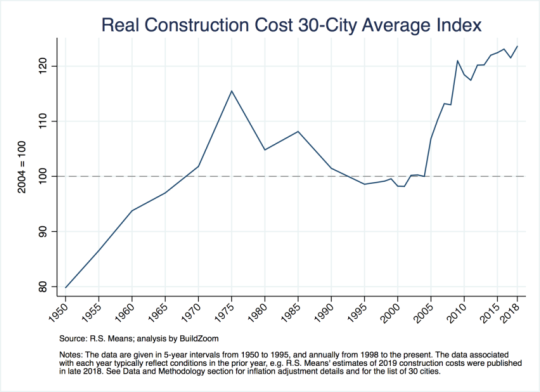
    BuildZoom, which is a tool to help people find local contractors, recently looked at construction costs across the US.

    Here is their 30-city average index running from 1950 to roughly today:

    image

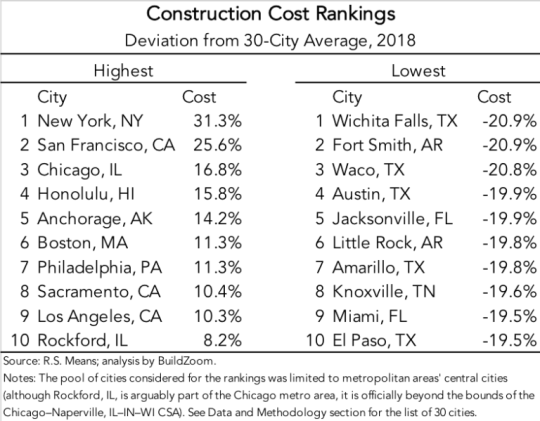
    Here is a chart showing the most and least expensive cities (that is, the cities that deviate the most from their 30-city average):

    image

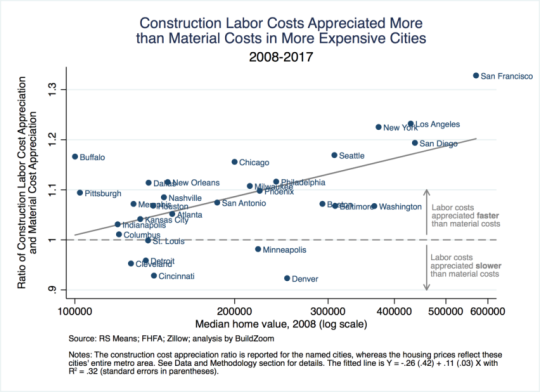
    And here is a chart that compares labor cost appreciation to material costs:

    image

    Labor costs account for the bulk of the geographic variation in construction costs and the most expensive cities to build in also tend to have the highest median home prices.

    The way to read the above chart is that any city with a y-axis value greater than 1 means that labor costs have appreciated faster than material costs from 2008 to 2017.

    In the case of San Francisco, labor costs have appreciated 32.8% (> 1.3) faster than material costs. 

    Part of this likely has to do with the fact that San Francisco is an expensive city in which to live. People have to be paid more if they’re going to work there.

    Full blog post from BuildZoom, here.

  • Fixing the MTA

    Fred Wilson wrote a great post on his blog today about New York City’s “transit mess.” 

    In it he talks about congestion pricing (which, as you all know, I support); the mess that is the Metropolitan Transportation Authority (MTA); and this 37-page report on how to improve the MTA.

    Here is an excerpt from his post that I liked, but that won’t be popular with everyone:

    That is an idea [congestion pricing] that has been proposed a number of times over the years, most notably by Mayor Bloomberg during his tenure. It is a good idea and long overdue. A dense urban environment should have excellent mass transit and incentives to use it and should have disincentives to drive cars. Taxing cars in Manhattan and using the revenues to maintain and improve our subways seems like an obvious thing to do.

    I would encourage you to give his post a read. The New York Times also reported on this topic (and the above recommendations) this week. They called it, 7 ways to fix the MTA (which needs a $60 billion overhaul).

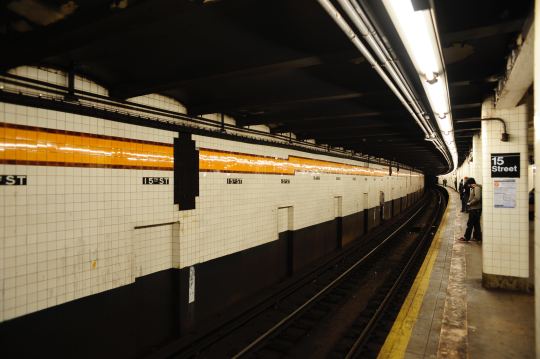
    Photo by Joren on Unsplash 

  • Boring Company ran a Tesla through its test tunnel

    This week Elon Musk’s Boring Company ran a Tesla through its 1.14 mile-long test tunnel in Hawthorne, California. This was accomplished by using a set of tracking wheels that Elon said, “turns a car into a rail-guided train & back again.” Apparently it is safe up to 150 miles per hour. Here is a video from yesterday’s unveiling (click here if you can’t see it below):

    [youtube https://www.youtube.com/watch?v=WQn-D-i5lyM&w=560&h=315]

    Some, or perhaps many, are skeptical of how this could work at scale in a dense urban environment. The company is imagining a world where every house or office building has one of these lifts (shown in the video) in their garage or basement. But there’s no question it is very cool and apparently this test tunnel only cost about $10 million per mile to dig. That’s progress in and of itself.

  • Toronto condo market outlook

    BNN Bloomberg just published this article on the Toronto condo market. It is based on a roundtable discussion that was held at their Toronto office last week with Jim Ritchie of Tridel, Jared Menkes of Menkes Developments, Shamez Virani of CentreCourt, and Jane Renwick of Diamond Kilmer Developments.

    The overarching theme is that, after a couple of frenetic record setting years, the market should settle down in 2019, which is likely a good thing. Hopefully that will also temper construction cost inflation. We have been seeing double digit increases over the last few years (hence some of the cancelled projects).

    But as Jared points out, the fundamentals here are still strong and there are a number of supply constraints creating upward pressure on pricing:

    Jared Menkes, executive vice president of high-rise residential at Menkes Developments was unwavering for the future. “There’s a lot of red tape that’s slowing down bringing more product to market,” Menkes said. “I promise you, pricing is going up.”

    For the rest of the article, click here.

  • Blue lights on train platforms

    Sadly, Japan has one of the higher suicide rates in the world. According to the World Health Organization, the rate from 2000 to 2016 was about 18.5 deaths per 100,000. The only country in Asia with a higher rate is South Korea. They are at 26.9 deaths per 100,000 (an alarming figure). For comparison, Canada and the US are at 12.5 and 15.3, respectively, which also seem rather high to me.

    I was intrigued to learn today that one of the ways that Japan has been trying to combat this high figure is by installing blue LED lamps on some of its railway platforms. Blue lights have been proven to have a calming effect (compared to white light). And since jumping in front of a train is unfortunately a common suicide method, blue lights were thought to maybe be a cost effective alternative to platform screen doors.

    The first blue station lights were installed on Tokyo’s Yamanote line in 2009. And according to this 2013 study – which looked at the possible impact across 71 train stations in Japan – the introduction of blue lights actually resulted in an 84% decrease in the number of suicides. Further studies also showed that there were no corresponding increases at other non-blue light stations. 

    It is an interesting example of “nudge theory”, but does it get at the root of the problem?

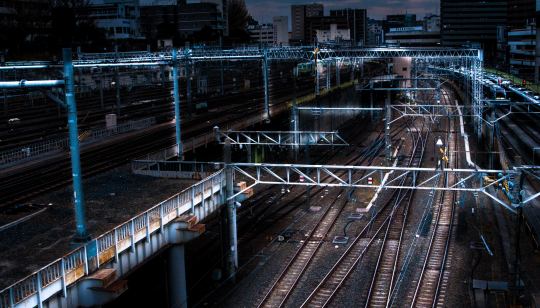
    Photo by Athena Lam on Unsplash