Daily insights for city builders, delivered every morning at 6 AM ET. I’m Brandon Donnelly — a Toronto-based real estate developer and founder of Globizen. I’ve been writing here since 2013.

  • Do Canadians embrace winter?

    Curbed published an article this week called, Why U.S. cities should stop whining and embrace winter. It is about Canada and how we allegedly embrace winter, which is arguably true, except I think there’s still a healthy dose of whining combined with trips to the south.

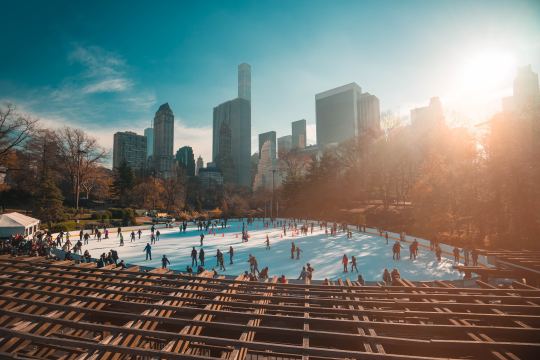
    I went ice skating a few weeks ago along the waterfront here in Toronto. It was a cold night and we debated whether we should skate or do something indoors involving Niagara’s finest red wines. We opted for skating and weren’t cold at all. It was great.

    I was reminded of this when I read the line: “The purpose is to get you skating. If you are skating, you are warm.” It is a good reminder that one of the keys to a successful winter space is physical activity. That and hot tubs.

    Photo by Joseph Barrientos on Unsplash

  • A new typology of cities

    Earlier in the week, my friend Rodney Wilts of Theia Partners sent me a JLL report called, World Cities: Mapping the Pathways to Success. I am admittedly only getting around to it now.

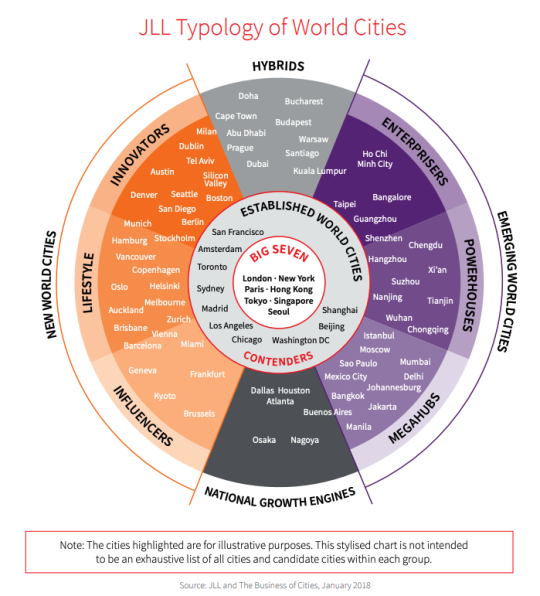
    The report proposes a new typology of world cities that looks like this:

    image

    It is based on 10 overall categories of cities, grouped into 4 main buckets. The first bucket is “Established World Cities”, within which there is the “Big Seven”, and then the “Contenders.”

    The Real Estate Highlights that accompany each category of city is a good place to start if you’re looking to do a quick scan of the report.

    Here’s a taste:

    One-quarter of all capital invested in commercial real estate globally currently lands in one of the “Big Seven” cities. And London and New York are easily at the top.

    Cities that recently graduated from “New World City” status – namely Toronto, San Francisco, Sydney, and Amsterdam – are all struggling to address housing and infrastructure deficits.

    “Lifestyle” cities – such as Vancouver, Auckland, and Oslo – are some of the most active investment markets. Biggest rental growth for prime offices (since 2000) in the “New World Cities” category.

    Click here for the full report.

  • Q4-2018 high-density land sales in Toronto

    image

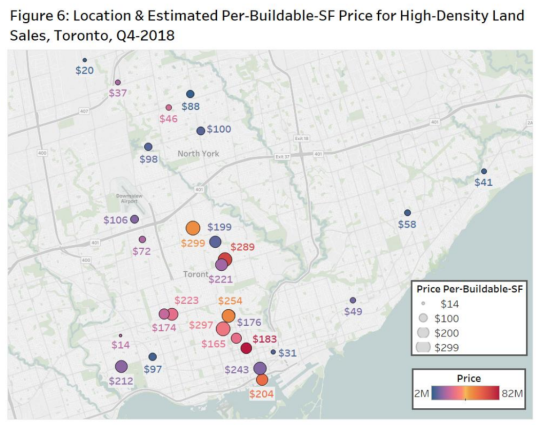
    Bullpen Research & Consulting and Batory Management just published their Q4-2018 High-Rise Land Insights Report for the Greater Toronto Area. 

    Above is a mapping of the estimated per square foot buildable prices for the land that traded hands specifically in Toronto last quarter. 

    The average is $178 per square foot. And the projected average sale (condo) price is $1,097 psf. That sounds right. You basically need that kind of end pricing to make the math work with today’s costs.

    Across the GTA, the average spread between zoned and unzoned land was almost $40 psf. $159 psf versus $120 psf, respectively.

    A full copy of the report can be downloaded here

  • Phoenix claws

    If you’ve ever watched a documentary on food, you’ve probably seen the terrible ways in which chickens are raised and farmed. If you have the means, free-range and organic is the way to go. But I appreciate that some – most according to this Economist article – must opt for whatever is cheaper.

    The Economist deals with the unfortunate side of the chicken industry, but it also talks about how chicken became the rich world’s most popular and widely traded meat. Since 1990, beef and pork consumption has remained roughly the same in OECD countries; whereas chicken consumption has increased by some 70%.

    Also interesting are the regional preferences when it comes to the parts of the chicken. Here is an excerpt from the article (and yes, I prefer white meat):

    Though Westerners prefer lean, white meat; many in Asia and Africa prefer dark meat, which includes legs and thighs. These preferences are reflected in local prices: in America breasts are 88% more expensive than legs; in Indonesia they are 12% cheaper. Differences in the price of chicken feet are even starker. The thought of eating talons is abhorrent to many Westerners, but they often feature in Cantonese recipes. China now imports 300,000 tonnes of “phoenix claws” every year.

    I reckon that a lot of this popularity has to do with chicken’s reputation as a healthy meat. That is certainly the primary motivation for me. Though I do get thrown off when I see the size of chickens on antibiotics. The Dutch have a word for this: plofkip. It translates to “exploded chicken.”

    I realize that this post has little to do with cities, other than the inference that Hong Kong is likely a major buyer of feet. But if you’re at all curious about the stuff you put inside your body – I clearly am – here’s the full article.

  • Largest airport in the world

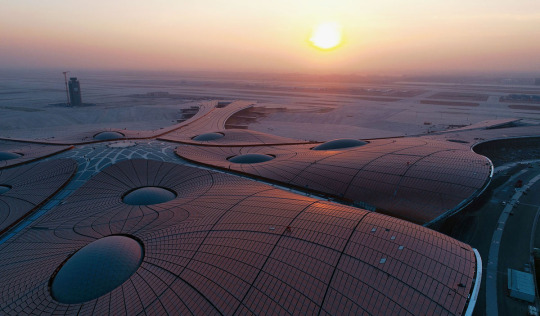
    I just finished scrolling through these photos (from the Atlantic) of Beijing Daxing International Airport, which is currently under construction about 46 kilometers south of Tiananmen Square. The first phase is expected to open in the second half of this year. It will be about 7.5 million square feet and be capable of handling some 72 million passengers per year (100 million at full build out). 

    Supposedly all of this will make it the largest airport in the world, which is pretty impressive considering Beijing Capital International Airport is already one of the busiest in the world. It too moves around 100 million passengers a year and is likely to overtake Hartsfield-Jackson Atlanta in the near term (if it hasn’t already).

    But in addition to being the biggest and baddest, two other things stand out to me about the design of Beijing Daxing. 

    The first is its starfish design. This was done to minimize the amount of walking between security and gate. Check-ins happen in the middle of the starfish and then the most you’ll ever have to walk is 600m (to end of one of the limbs). That’s in line with what most people would consider a reasonable urban transit radius.

    The second is the fact that the check-in area provides an aerial view of the gates below. You can see this layering in the photos from the Atlantic. This was done to create a visual connection between passengers and their family and friends. Usually, the goodbye waves happen at or before security. Here you get a bit more time. (Will security be an issue?)

    For the full set of photos from the Atlantic, click here. I have a thing for airports, so I thought this was a great set.

    Image: Wang Mingzhu via the Atlantic 

  • Archival street life footage

    Guy Jones is a videographer who specializes in archival footage, or at least that is what his YouTube account suggests. He edits old videos and makes them more watchable by doing things like adding sound and slowing them down to a natural rate. 

    (Older films often appear sped up because they were recorded at less than 24 frames per second and then later played at 24 or more frames per second.)

    I’ve blogged about one of his videos before. This one of New York City in 1911. But he has so many other fascinating films on his channel – including a frozen Ottawa from 1942 – that I figured I would share it in its entirety today

    For the city builders in the room, here are some street life videos of Paris in la Belle Époque (1896-1900), New York City in 1927, and London in 1967. Among other things, it is fascinating to see how quickly the car crept its way into our cities.

    The video of Paris is all horses and moving walkways. The video of New York City (1927) is all cars. And if you look at the other video of New York from 1911, you’ll see a city in the midst of that transition.

  • Non-load-bearing curtain wall

    image

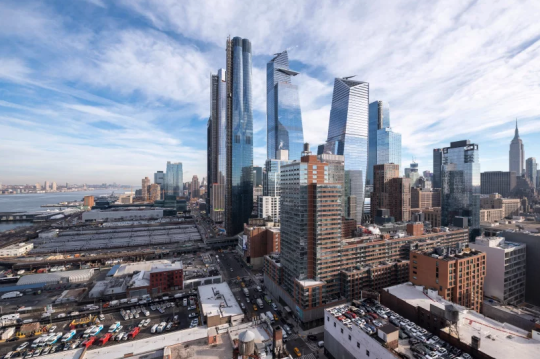
    Liz Diller of Diller Scofidio + Renfro was recently asked by designboom about how her firm approached the design of Fifteen Hudson Yards (the first residential tower in New York’s Hudson Yards).

    The firm had never designed a high-rise before. So while their typical approach would be to analyze program, here they were heavily informed by the views – both in and out from the site – as you move up the tower.

    The 88 storey tower transitions between two footprints. The base matches the street grid of the city, but as you move up the tower it transforms into a cloverleaf – allowing panoramic views of the city.

    It is a somewhat similar approach to what has been proposed by Studio Gang for One Delisle. Except for the transformation here is to a multifaceted cylindrical shape (a hexadecagon is what has been drawn).

    From the late 19th century when Chicago began to pioneer the modern skyscraper, architects and engineers have been thinking about how you treat a tall building as you move from top to bottom.

    Chicago architect Louis Sullivan responded to this challenge with his tripartite approach to design. He believed that tall buildings should be characterized by three main divisions: a base (bottom), a shaft (middle), and a cap (top).

    The technological innovation that allowed this thinking to flourish was the non-load-bearing curtain wall. Once the exterior walls of a tower no longer supported the actual building, architects then had the freedom to really experiment.

    This remains true to this day, but we no longer need to confine ourselves to only three parts. New technologies now allow for more.

    Today we have parametric modeling and other design tools that allow us to create new geometries and transitions; forms that would have been pretty complex to draw up in the past. 

    In the case of Fifteen Hudson Yards, every floor plate from 20 something and up is slightly different. I wonder what Louis would think of this.

    Image: Timothy Schenck via designboom

  • A mapping of development potential in Toronto

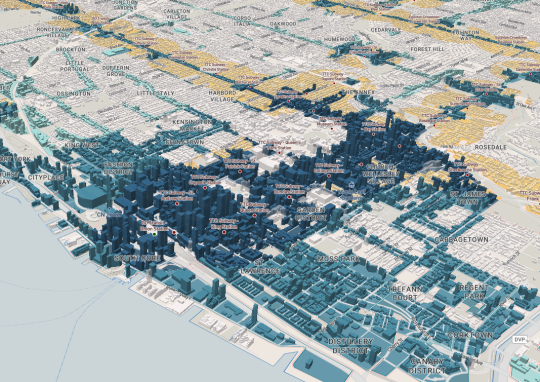
    I first met Monika Jaroszonek in 2017, right before she started RATIO.CITY. Since then she has developed some pretty incredible tools for the city building space.

    Yesterday the company published this interactive visualization looking at development potential across the City of Toronto. The mapping looks for the following:

    The tool then ranks each development site – AAA, AA, A – according to how many of the above criteria it meets.

    It also flags land that it refers to as “Missed Opportunity.” These are lands located within 500m of a Major Transit Station, but that are designated as Neighbourhoods (considered stable) or Employment (whole other discussion).

    Based on this filter, about 5.6% of the City’s land is a “Missed Opportunity” and about 1.2% is AAA.

    When you look at the visualization, that is one of the first things you will probably notice; a lot of our transit infrastructure is currently underutilized as a result of land use policies.

    Image: RATIO.CITY

  • Unusual ski-spots around the world

    “Like so many sports that humans do,” he [Kari Medig] says, “skiing can seem absurd: sliding over the miracle of frozen water, slipping down steep mountains wearing layers of crazy clothes—it really is a strange thing to do.”

    I love skiing (well snowboarding to be exact). And I love photography. So here is an interesting photo essay from FvF about “the unexpected diversity of the ski community.” It features the work of Canadian photographer Kari Medig.

    Kari’s career is centered around photographing unusual ski-spots around the world. He has discovered that every locale has its own unique subculture. In some places, skiing is about status. But in other places, people depend on it for their livelihood.

    Eventually Kari hopes to turn this lifelong ski project into a book. I sure hope he does that. I bet it would do very well on Kickstarter. (On a largely unrelated note, his photos of Rio de Janeiro are at least 100x better than mine.)

    Image: Kari Medig

  • Laneway house on the market for $2,845,000

    I was looking at this laneway house for sale in Toronto today. It’s located near Queen and Bathurst. It has 3 bedrooms and 3 bathrooms and is about 2,331 square feet (that looks to include a basement). The lot appears to be just over 13′ wide. And the asking price is $2,845,000.

    Single family homes aren’t typically considered on a per square foot basis, but if you do the math here, it works out to be around $1,220 psf. The property previously sold in 2017 for $805,000, which was prior to it being redeveloped. So it likely traded based on land value.

    When Toronto first started considering modern laneway houses, some people thought that only individuals of questionable moral fiber would want to live in one. But today, there are countless examples of some pretty remarkable laneway houses. 

    And in some cases you might need about $3 million or so.