

Daily insights for city builders, delivered every morning at 6 AM ET. I’m Brandon Donnelly — a Toronto-based real estate developer and founder of Globizen. I’ve been writing here since 2013.

Category: Urbanism

  • How Gunter’s chain forever changed our cities


    In 1620, an Englishman by the name of Edmund Gunter invented a land surveying device known as Gunter’s chain. As the name suggests, it was an actual chain (see above). Each chain contained 100 links and, when fully extended, it measured 66 feet.

    This was a monumental innovation as it greatly simplified land surveying and made it a lot easier to measure out acres — especially if you maybe weren’t great with math. So it is perhaps no surprise that this simple device forever changed our cities.

    But first, here’s the only math you need to know:

    Number of chains x number of chains / 10 = number of acres

    For example:

    A lot measuring 66 feet by 66 feet would mean it has an area of 4,356 square feet, or 0.1 acres (1 acre = 43,560 square feet). It would also mean that this lot measures 1 chain by 1 chain, or 1 square chain. Take 1 square chain and divide it by 10, and you arrive at the same 0.1 acres.

    Similarly, a lot measuring 660 feet by 660 feet would mean it has an area of 435,600 square feet, or 10 acres. Using Gunter’s chain, this lot is 10 chains by 10 chains, which equals 100 square chains. Divide 100 square chains by 10 and you arrive at the same 10 acres.

    Put differently, 1 acre equals 10 square chains in Gunter’s system.

    Because of its simplicity and utility, the chain became a statutory unit of measurement in England by the 1670s. And as a result, it spread throughout the British Empire, meaning it started to influence how new cities were being planned and laid out.

    Let’s look at the example of Salt Lake City.

    We have spoken before about the city’s famously large blocks. They have the dubious distinction of being the largest in the US. But what you may not have noticed is that the typical SLC block measures exactly 660 feet x 660 feet. Its typical streets are also 132 feet wide.

    This is because of Gunter’s chain. These are 10-chain x 10-chain blocks and 2-chain streets.

    The same is true of other cities. Looking on the other end of the spectrum, Portland’s compact street grid is comprised of blocks that measure 198 feet x 198 feet. These are, in other words, 3-chain blocks. Its typical streets are also 33 feet wide. So half-chain streets.

    Units of measurement have a lasting way of influencing how we plan and design things. This is true at small scales and it’s also true of our cities. In tomorrow’s post, we’ll look more closely at Salt Lake City’s street grid and what it does to walkability.

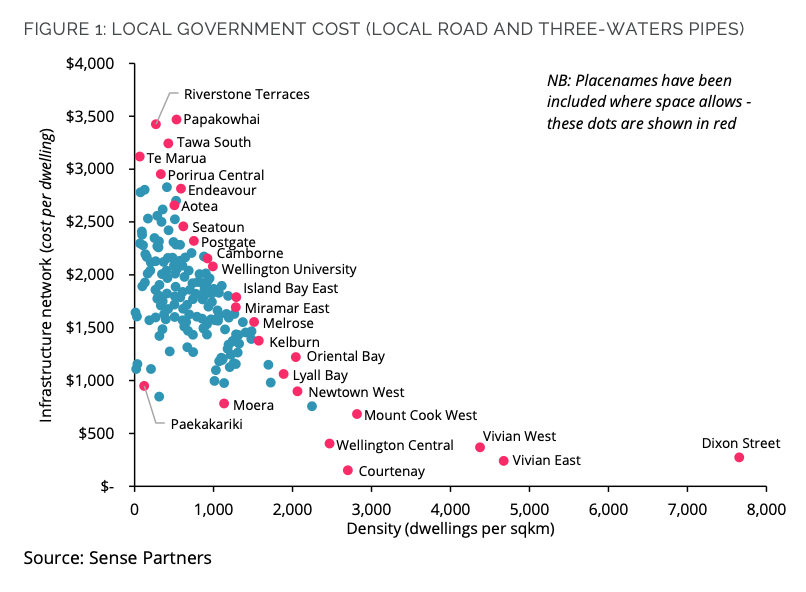
    Image: National Museum of American History

  • Olympic athletes will — probably — be able to swim in the Seine

    Since the modern Olympic Games were revived in 1896, no city has ever hosted swimming events in an urban river. Too poopy. But Paris, as we talked about, hopes to be the first. Starting on July 30, the Seine is scheduled to host the swimming portion of the triathlon competitions.

    Except, it will depend on water quality. Today’s training sessions (scheduled for Sunday, July 28) were cancelled because water tests showed that the Seine is currently below acceptable standards. This is due to heavy rain over the last few days, which I guess overloaded the city’s storm network.

    So what is clear is that — 36 years after then-Mayor Jacques Chirac first promised to clean up the river — the city has only been able to successfully achieve this, sometimes. It’s not an easy task.

    According to Bloomberg, the clean-up efforts have already cost €1.4 billion. This was spent on doing things like constructing a 50,000 m3 holding basin (about the size of 12 Olympic-sized pools) under the Gare D’Austerlitz. This now holds storm overflow during heavy rain events, in lieu of it going into the Seine.

    But this doesn’t provide any guarantees as evidenced by today’s cancelled training sessions. Presumably, it just makes it less likely for overflow stormwater to get dumped into the Seine. So a cynic might ask: Why bother with all of this?

    Well, for one thing, swimming in a river in the middle of a major global city is just plain cool. Look at how the Swiss do it. But another reason could be that you want to create one of the greenest cities on the planet. And if that’s the case, then seeing athletes swimming in the Seine is a pretty powerful image.

    It shows progress.

    Photo by J Shim on Unsplash

  • Nashville’s live music venues

    I’ve never been to Nashville, but I hear it’s a pretty good city for music. According to this new report from PennPraxis, titled the Nashville Independent Venues Study, the city has 252 venues that showcase live music. And more than 100 of them are solely dedicated to music.

    This gives Nashville one of the densest clusters of live music venues per capita, anywhere in the world. I also remember reading somewhere that the majority of venture funded startups in the city are in the music industry. So Nashville has a real music ecosystem going.

    Of course, when you’re really good at something it can create a dual-edged sword. In the case of Nashville, this success has led to growth, more bachelor/bachelorette parties being hosted in the city and, ultimately, developers wanting to build lots of new things.

    Right now, the city seems to be grappling with how best to balance this growth against the preservation of its live music scene. And that’s what this new report is focused on.

  • On-street residential parking is too cheap

    The minimum size of a parking space in Toronto is 2.6 m wide x 5.6 m long. (It can change based on other factors, but this is all you need to know for today’s post.) This works out to 14.56 square meters or ~157 square feet in area for a typical spot.

    Building a parking space of this size in an underground or structured parking garage is very expensive. I have seen the former cost over $200k per space once you include everything else that goes along with building below-grade parking.

    However, this opinion piece reminded me that if you’d like to rent an equivalent area on the streets of Toronto, you can do that for a lot less. If it’s your first vehicle permit and you have no on-site parking where you live, the 2024 cost is $22.19 (plus HST) per month.

    That works out to a monthly land rent of approximately $0.14 per square foot.

  • Density lowers infrastructure costs

    This is an important chart from a recent study commissioned by Greater Wellington, New Zealand. The study looks at the cost benefits of urban intensification and the above chart shows the relationship been density and infrastructure costs. For this study, they specifically looked at the costs that local governments face in providing road, public bus transport, and “three-waters infrastructure.” I hadn’t heard this latter term before, but it refers to drinking water, wastewater, and stormwater.

    What they obviously found was that there are real economies to higher densities. More density lowers the per dwelling cost of delivering infrastructure. In the case of three-waters infrastructure, it doesn’t even really matter if you’re proximate to reservoirs or treatment plants. The bulk of the cost lies in the local connection pipes. So what matters most is how many dwellings you can service off of the main lines — even if these lines need to be upsized.

    The goal of this study is to enable more support for smart growth within the Wellington region:

    Regional councillor Thomas Nash says the report should give councils confidence to press on with plans that support compact mixed-use development in and around city centres and connected by high quality public transport. 

    “Regional growth needs to be smart growth. This report clearly shows that the best bang for our buck is to focus on upgrading existing water, public transport and local roading infrastructure so that we can build better quality, compact residential form, with improved amenities within our cities and towns,” Cr Nash says.

    Of course, this doesn’t just apply to Wellington. Every city should read the study.

  • I really want to live over there

    One way to describe cities is to call them labor markets. Historically, people have chosen to live in cities because they have provided economic opportunities (among, of course, many other things). That’s why the data is very clear: wages are higher in larger cities.

    But what we have also seen over the last few years — and what is causing a lot of dislocation in real estate markets — is an untethering of work. More people are working from home and from locations that offer greater lifestyle benefits (or greater tax benefits).

    We spoke recently about what this divide between in-person and remote work might mean, but regardless of this outcome, I think there’s an important truth here: Lots of people would like to live somewhere else. (In my case, my daydreams take me to Paris.)

    And for the first time ever, really, it is possible for more people to do this and stay connected to work somewhere else. Earlier innovations, such as the streetcar or car, also compressed geographies and empowered people to travel greater distances. But now the catchment area has seemingly expanded to the world.

    I’m not saying anything particularly novel here, but I do think it’s important to point out that this desire exists in many of us. Because this tension between “I do work here” but “I really want to live over there” seems like it’s only increasing.

  • Toronto is the fastest growing metropolitan area in Canada and the US

    Last month, I wrote a post called, More people, fewer new homes. And in it, was a chart showing that for the 12 months ending July 1, 2023, Toronto grew by approximately 126,000 people, and the Greater Toronto Area grew by about 233,000 people. Big numbers. At the end of the post, I also mentioned that this is more growth than the city has seen over the six preceding years.

    But how does this compare to other cities in Canada and the US? If we look at only central cities (not metro areas), Toronto is, in fact, first. Canadian central cities, in general, also seem to be growing more quickly than their US counterparts. After Toronto is Calgary, which added nearly 87,000 people for the same time period.

    Looking at metro areas, Toronto is still first. I don’t know why the ~222k figure, here, doesn’t reconcile with the ~233k figure from last month’s post, but presumably it’s some sort of boundary difference. In any event, Toronto is first. But now, once you include metro areas, US cities do much better in this list. Number two is Dallas-Fort Worth-Arlington.

    This difference between central cities and metro areas likely tells us something about the way in which these city regions are growing. Still, it would be interesting to see how much of this population growth is being accommodated through infill development vs. greenfield development. One way to measure that might be to look at changes in the footprint of their built up areas.

    For more about the above two charts, check out this recent post from TMU’s Center for Urban Research and Land Development.

  • In-person vs. WFH might become a critically important distinction

    I’ve been thinking more about yesterday’s post and what it might mean for cities, and I’d like to add some additional thoughts. The report that I linked to looks at what the fiscal implications of WFH have been on a number of US cities (at least so far). That is the chart that I shared summarizing New York City’s “agglomeration losses.”

    But along with this, there is an important assumption that we have not yet reached a new equilibrium. In other words, we are still in a period of adjustment, which feels right, especially if you talk to anyone in the commercial real estate industry. And that means that there are alternative and largely unknowable scenarios for the future.

    In the report, they study the following three:

    • Doom loop prevails (current state where city finances get worse)
    • Recovery (cities regain their pre-pandemic levels of agglomeration economies)
    • Virtuous boom loop arises

    Obviously the objective with their recommendations is to help cities achieve this last one. This is the scenario where cities regain prosperity because firms are able to simultaneously increase their concentration of high-value in-person workers (who benefit from agglomeration economies) and shift all the other stuff to WFH (which allows firms to save money and drive efficiencies).

    More specifically, this scenario assumes that agglomeration economies start to grow again; that wages increase because of it; and that firms, overall, become 10% more productive. It also assumes that office real estate values recover to pre-pandemic levels.

    The future is, of course, notoriously difficult to predict. But I am optimistic that the best and most desirable cities will figure out how to create a new virtuous boom loop. History has shown us that cities are remarkably resilient.

    However, implicit to this discussion seems to be the creation of two classes of workers: workers who are expected to show up in-person and do innovative things with their colleagues, and workers who are encouraged to stay at home and do the tasks that do not benefit from co-location. Of course, lots of people do both of these things. But for the purposes of this post, let’s just compare and contrast these two.

    Importantly, these two types of workers are expected to have different wage outcomes (in the above report). For WFH workers, wages are initially modeled to fall because of the loss in agglomeration-related productivity. But interestingly enough, before this wage decline happens, WFH workers are unambiguously better off — they have the same salary and none of the direct costs of going into the office.

    On the other hand, in-person workers are modeled to have their wages increase because of the gains in agglomeration-related productivity. The authors of the report have calibrated their models so that these two types of workers eventually become equally well off, once you adjust for changes in wages and things like the direct costs of commuting. But what would this really mean in practice?

    To oversimplify, we’re talking about two different types of workers:

    • An in-person worker who is expected to have higher wages, be more productive, and live closer to a city center because of their need to be physically present
    • A WFH worker who is expected to have lower wages, be less productive, and live further out (or in a different city) in order to equalize their lower earnings by way of less expensive real estate

    If this is how our labor markets evolve, then it strikes me that there could be far-reaching socio-economic implications. What I worry about is further segregation within our cities. The above scenario means doubling down on the role of big cities as centers for innovation and agglomeration economies. But in doing this, how do we ensure that we don’t exclude everyone else?

    Once again, I suspect that a good place to start would be lowering the cost of new housing and increasing the pace of production.

    Photo by Lerone Pieters on Unsplash

  • Doom loop or boom loop?

    One of the interesting things about return-to-office trends is that there’s a meaningful difference between smaller and larger cities. In smaller cities, most people have returned to working in their offices. But in larger cities, this hasn’t been the case. This makes intuitive sense. Larger cities tend to have more expensive real estate (which forces people to decentralize) and, in turn, longer and more punishing commutes. So in a larger city, the individual benefits of WFH (i.e. having zero commute costs) tend to be far greater.

    However, in-person interactions are critical to what are known as agglomeration economies. This is why we have things like financial districts — because there are real economic benefits to even competing firms locating proximate to each other. WFH arguably reduces these benefits. And in this recent report called, Doom Loop or Boom Loop: Work from Home and the Challenges Facing America’s Big Cities, the authors, Richard Voith, David Stanek, and Hyojin Lee, have tried to estimate what these agglomeration losses might be for cities like New York, San Francisco, and Philadelphia.

    Here’s New York City:

    If you agree with their assumptions, then you might also agree with their policy recommendations. Among other things, the report argues that larger cities, like New York City, should be focused on promoting themselves to industries/jobs that benefit the most from in-person interactions, recognizing that WFH isn’t going away. At the same time, cities should understand that reducing the cost and increasing the pace of housing production also helps to reduce agglomeration losses. It keeps more people centralizing around a particular place.

    To download the full report, click here. It’s an interesting read.

  • In praise of leaving home

    As some of you know, I take a French class one evening every week. I have chosen to go in person, but apparently the majority of students enrolled at the school, don’t. They do it online, which is obviously easier for everyone. Call me old school, but I prefer being in a classroom, especially when trying to learn and perfect a language.

    I was reminded of this as I read through this recent article by Alain Bertaud. Alain is perhaps best known for his book, Order without Design: How Markets Shape Cities, and so it’s no surprise that he would write an article praising the randomness of cities. In it, he talks about how it is, of course, possible to never leave home. Meetings, food, entertainment, and exercise all happen online.

    This is convenient and all, but:

    Randomness makes city life exciting and productive, and how we design cities can multiply or reduce the chances of serendipitous encounters of people and ideas. Creativity and innovation, two of the most desirable traits of metropolitan environments, depend on unplanned meetings between people of different skills, tastes, and backgrounds.

    So here’s to leaving home, sometimes.