Daily insights for city builders, delivered every morning at 6 AM ET. I’m Brandon Donnelly — a Toronto-based real estate developer and founder of Globizen. I’ve been writing here since 2013.

Author: Brandon Donnelly

  • Melting lollipops

    I’m out of office for the next week and so I’m going to try a bit of photoblogging. Here is a photo that I took this afternoon at Elena Bulatova Fine Art Gallery on St. Armand’s Circle. I really liked the art, and especially the melting lollipops and popsicles. They certainly felt climate appropriate.

  • Homes built in the past year

    I’m on a flight right now reading the latest issue of Monocle Magazine in a seat that barely accommodates the length of my femur. This month’s issue has their annual ranking of the top 25 cities in the world.

    Munich is first, which is not unusual for their ranking methodology. It generally scores well. Quality of life is high. Crime is low. The economy is strong. Beer gardens are fun. And you’re close to the Alps for snowboarding.

    One stat that caught my attention — and it’s not included for all of the cities — is the number of homes built in the past year. Presumably this is all housing units in the metro area — for sale, for rent, subsidized and so on.

    Here are their (clearly rounded) numbers. The order is as they appeared in the ranking, but again, not ever city included this stat.

    • Munich: 8,300
    • Tokyo: 150,000
    • Copenhagen: 5,000
    • Berlin: 11,000
    • Madrid: 1,600
    • Hamburg: 7,000
    • Melbourne: 5,100
    • Helsinki 4,400
    • Stockholm: 7,000 (18,000 in Greater Stockholm)
    • Sydney: 39,000
    • Hong Kong 17,000
    • Vancouver 22,600
    • Amsterdam 5,100
    • Kyoto 8,900
    • Dusseldorf 2,600
    • Barcelona 1,000

    Some of these numbers appear to stand out, such as the counts for Tokyo, Sydney and maybe Vancouver. But it’s hard to draw any conclusions around housing supply and housing affordability.

    Melbourne and Amsterdam allegedly have the same number of homes built over the past year, but according to Monocle the metro areas of Melbourne and Amsterdam have populations of 4.85 million and 2.4 million, respectively. This also says nothing about their growth rates.

    So which one is doing a better job of addressing housing demand? I’m not sure.

    But it was still interesting to see that Tokyo delivers somewhere around 150,000 homes a year. Tokyo is somewhat unique globally in that it’s a big city — one of the biggest — that somehow manages to gracefully balance both scale and quality of life.

    Photo by Elias Keilhauer on Unsplash

  • Minimum fleet

    Here is an interesting study by the MIT Senseable City Lab, which looks at: “the minimum number of vehicles needed to serve all the trips in New York without delaying passengers’ pick up times.” If you can’t see the embedded video below, click here.

    [youtube https://www.youtube.com/watch?v=nFo64kBGF6o&w=560&h=315]

    This is interesting because it begins to quantify the amount of waste running through the system today and the possible efficiencies brought about by autonomous vehicles. In this model, the current taxi fleet in NYC could be reduced by 40%.

    For more on the study, go here.

  • Portland is considering whether to solve traffic congestion

    image

    Chris Hagerbaumer is the deputy director of the Oregon Environmental Council. She recently delivered the below testimony on “variable traffic-based tolls”, a form of road pricing. This is something we have talked a lot about here on the blog. 

    Oregon is currently looking at implementing this on two freeways in Portland, which is why Chris delivered this testimony. And as many of you know, I am very much in support of this demand management approach. So here you are: why congestion pricing makes sense for Portland (taken from City Observatory).

    ——————————————————–

    The question in front of you is: how do we actually solve congestion, solve it in a way that is the least cost to the taxpayer, and in a way that doesn’t result in more pollution. When we add more supply (in other words, build more roads) we end up exactly where we started when it comes to congestion (due to induced demand), we spend billions of taxpayer dollars (much of which comes from drivers who aren’t the ones demanding more road space), we harm surrounding communities as highways encroach into neighborhoods, and we pollute the air and heat up the planet.

    Induced demand is the fact that when you add freeway capacity it induces longer trips, more sprawl and more driving. Traffic is like a gas, expanding to fit whatever space there is. In one infamous example, Texas spent nearly $2.8 billion expanding Katy Freeway to 26 lanes and congestion has actually worsened.

    Building new roads is a supply-side solution that simply doesn’t work.

    An effective, least-cost, environmentally sound way to address congestion is the proposal before you: congestion pricing to manage demand. Drivers pay an automated fee to enter highly congested roads at peak hours; in return, they travel smoothly and reliably, getting where they need to go on time. Prices are set at the lowest possible level to free up just enough road space to eliminate bottlenecks.

    When you eliminate bottlenecks and get traffic flowing freely, you have—in essence—added capacity. You no longer need to add new lanes, you save taxpayers a bundle, and you reduce dangerous auto and truck exhaust.

    Congestion pricing is a demand management solution that’s proven to work and does so in cities around the world. Drivers opposed congestion pricing at first: no one wants to pay more. But that opposition of 60% or more turned into support of 60% or more after congestion pricing was implemented. People’s opposition turned to support because they now get that it works—they experience the value.

    Equitable application of congestion pricing absolutely requires mitigating diversion to local streets. But note that congestion pricing actually pulls many drivers who were already cutting through local roads back to the highway because those drivers who were stuck in traffic now have an option to get where they need to go, on time, for a small price.

    Equitable application of congestion pricing also requires significantly increasing transit service and other travel options in the corridor and considering other means to make the system work for low-income commuters who must drive during peak hours, such as targeted discounts or exemptions.

    We think of highways as free and we think of driving as freedom, but by investing almost solely in infrastructure for cars over most of the 20th century and into the 21st century, we created a transportation system that is costly not only for our pocketbooks, but for our very health and wellbeing and our region’s economic prosperity, a transportation system that contributes to the existential risk of runaway climate change.

    You have an opportunity to make a decision that will lead to less time stuck in traffic, healthier air, and more economic prosperity for the region and state. We hope you embrace that opportunity.

    Photo by Zach Savinar on Unsplash

  • Twin Palms turns 60

    2018 marks the 60th anniversary of the Twin Palms neighborhood in Palm Springs, California, and Houzz has just published an excellent story describing the subdivision’s history and its importance for mid-century modern architecture.

    Designed by architect William Krisel and developed by Alexander Construction, the community was initially built with 90 homes. Supposedly each lot was exactly 10,000 square feet and each house had the exact same 40′ x 40′ square floor plan. So 1,600 sf homes.

    In addition to this, each lot had a carport, an open courtyard connecting the house and carport, and a swimming pool. 

    Unlike some of his contemporaries, Krisel was less interested in building one-off homes for the wealthy. He was more interested in tract housing for the masses. And standardizing the plans was one way to achieve greater affordability.

    Krisel still found other creative ways to differentiate the homes, namely by rotating the square floor plan and by rearranging the carport, courtyard, and pool.

    He also employed different rooflines, all of which have become emblematic of this era of architecture and of Palm Springs in general. It was about optionality on top of and around the box.

    If you have a few minutes, check out the Houzz article. The homes are beautiful and the story is compelling: the modern American dream at an affordable price.

    Photo by Nainoa Shizuru on Unsplash

  • Toward penthouse amenities and smaller units

    image

    The NY Times reported this week that, as the ultra luxury real estate market in New York City continues to cool, developers appear to be making two kinds of product adjustments: (1) they are converting the penthouses and rooftops of their buildings from premium residential space into amenity spaces for the broader building and (2) they are shrinking unit sizes to help with overall sales and leasing velocity.

    According to the New York Times, condo prices on Billionaires’ Row in midtown are down 20-40% since the peak of the market in 2014 when this record was set. So developers are responding with more studios and 1 bedrooms, and amenity spaces – many of which now include high end restaurants also open to the public – that ensure no other building has something you don’t have.

    However, there are naturally some differences between condo and rental buildings. Since 2016, 35% of rentals projects in the city have had some sort of penthouse amenity, whereas the number is only 13% for condo buildings. This makes sense given that amenities are such a big driver of leasing. You definitely want your amenities ready for when your leasing office opens.

    What product changes, if any, are you seeing in your market right now?

    Photo by Aaron Burson on Unsplash

  • Urban metabolism

    I spent this morning in the suburbs bouncing around to a few different meetings. I then came back downtown so that I could get some actual work done in the office. And then after that, I was around downtown getting a bunch of different things done.

    I am mentioning this to you all because today I was reminded of how different the metabolic rate can feel in the city compared to the suburbs. There are even studies suggesting that people walk faster in larger cities.

    Some businesses, of course, require a lot of space and the economics simply do not work in the core of the city. We all get that. But if you’re competitive advantage is human capital, then this is something to think about.

    I feel like I spent most of my morning driving around, which I’m not complaining about, except that I could have probably had 3x as many meetings in the city during that same period of time. If you multiply that out over time, then we’re talking about a material spread in overall productivity.

    And we haven’t even touched on those fortuitous urban encounters, which do happen and do provide all sorts of benefits. As much as we’re all connected like never before – through things like, well, this blog – there’s nothing like shaking somebody’s hand and looking them in the eyes.

  • The Hess triangle

    A friend of mine recently shared this Twitter thread with me. It is by Chaz Hutton. I didn’t know who Chaz was before I read the thread. But I now know that he draws things, sometimes for the New Yorker.

    Chaz’s Twitter thread covers the history behind what was once believed to be the smallest plot of land in New York City. He also positions the story as the “perfect embodiment of New York’s attitude.” Guess what the means.

    The story is about the isosceles triangle pictured above, measuring 25-1/2″ at its base and 27-1/2″ along its sides. It is known as the Hess triangle and it reads: “Property of the Hess Estate which has never been dedicated for public purposes.“

    Click here for the full story.

    Image: Chaz Hutton

  • Firm Profile: APOLLO Architects & Associates

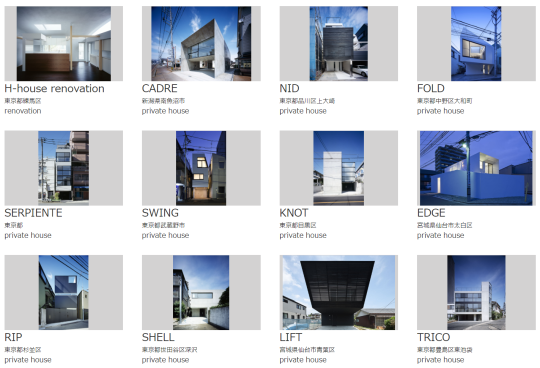
    This afternoon my friend Gabriel, of Gabriel Fain Architects, sent me the work of APOLLO Architects & Associates. They are based in Japan and South Korea. Here is a preview of some of their “private houses”:

    There is a lot that I love about these homes. 

    I love their simplicity. Look at this handrail detail. Nothing more than what is absolutely necessary.

    I love their modesty. Many of the above homes hover around 150 square meters and many of them are much much smaller. 

    I love that each project’s description starts by talking about the owners and the site conditions, signaling that each home represents an individual response tailored to both the occupants and the context.

    And I love that many of these homes have been built on unthinkably small parcels of land in dense urban settings; parcels that would be dismissed as entirely useless in other parts of the world. 

    The site area for this home is 46.53 square meters and the building’s footprint is 36.93 square meters.

    Of course the Japanese housing market is a unique place. It’s worth pointing that out

    But as I browsed through what are effectively custom single family homes, I couldn’t help but be reminded that there’s a fine line between need and want.

    Small can be very beautiful. But small is also subjective.

  • The vertical city

    We often talk about agglomeration economies in terms of their horizontal clustering within cities. But a new paper in the Journal of Urban Economics – summarized here by Richard Florida – has looked at the other dimension: the vertical clustering of economic activity within tall buildings. 

    Here is an excerpt from Florida’s piece in CityLab:

    Economic activity is also sorted vertically, with higher-profile and more profitable firms occupying higher building floors. Law offices are disproportionately represented on the highest floors, taking up more than a third of floor space above the 40th floor, compared to 12 percent of floor space between the second and 40th floors. Finance, insurance, and real estate take up roughly 20 percent of floor space above the 40th floor, compared to 23 percent between the second and 40th floors. Business services, engineering, and miscellaneous other industries are also more likely to take up more space below the 40th floor.

    The other takeaway is that there appears to be a greater rent premium attached to higher floors (vertical movement) than for being located closer to the central business district (horizontal movement). This surprised me. But I also don’t have access to the full paper. Is the dataset just US cities?

    Nevertheless, the idea of a vertical city interests me a lot. And I agree with the authors of the report that, for perhaps obvious reasons, it is far less studied compared to horizontal development patterns.