Daily insights for city builders, delivered every morning at 6 AM ET. I’m Brandon Donnelly — a Toronto-based real estate developer and founder of Globizen. I’ve been writing here since 2013.

Author: Brandon Donnelly

  • Lyft announces subscription plan

    Last week, Lyft announced a new subscription plan

    It costs $299 every 30 days and you get 30 rides included (up to $15 each). So it represents a possible 1/3 discount on rides. If you go over the 30 rides per month or over $15 on any one ride, you simply pay the difference. Though as a subscriber, you get 5% off additional rides.

    Subscriptions are good for business. They can be like an annuity. And I suspect that with the above model, there will be unutilized rides every month that the company is just able to bank. You can’t carryover rides with this plan.

    But moreover, Lyft’s “All-Access Plan” is designed to help you ditch your car. Trade your car payment for a ride subscription plan. So if the numbers didn’t quite work for you before, maybe they do now. Depending on the situation, I can certainly see this plan being cost effective.

    But as ride hailing/sharing continues to nibble away at public transportation and personal vehicle ownership, what will this mean for cities?

  • Decline of children in some, but not all, parts of Chicago

    The Institute for Housing Studies at DePaul University recently published this overview of the “socioeconomic factors affecting demand for housing in Chicago.”

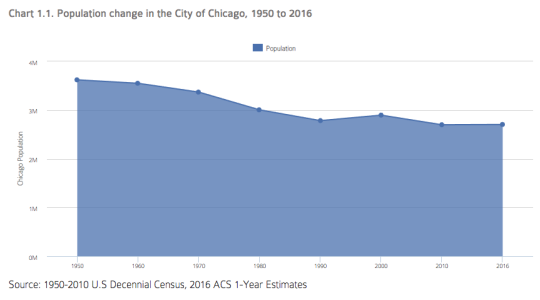
    Here is the change in population in the City of Chicago from 1950 to 2016:

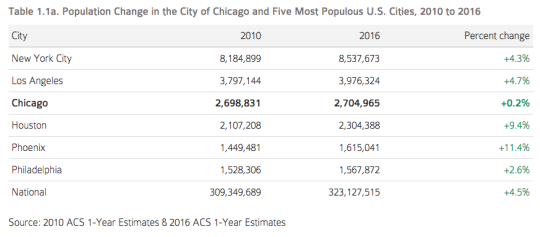
    And here is a comparison between Chicago and the five biggest cities in the US. Note the “sun and sprawl” phenomenon. Also note that the list below is for city proper boundaries.

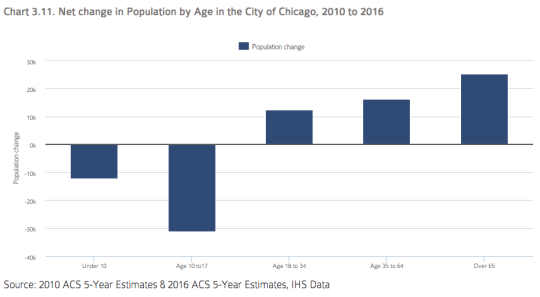
    One particularly interesting set of stats is the decline of children (population under the age of 18) in the city:

    Since 2010, the city has lost over 40,000 children and teenagers. 

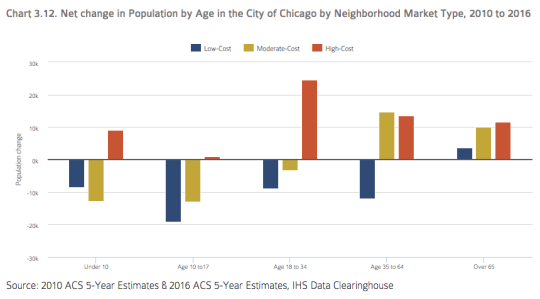
    But, if you break it down by neighborhood market type, it is the low-cost and moderate-cost neighborhoods that lost the population. The high-cost neighborhoods were up.

    The study posits that the old trend of moving to the suburbs after you have kids may not be for everyone – provided, of course, that you have the means. And it goes beyond Chicago. DC is predicting a 25% increase in K-12 students within the District.

    For the rest of the charts, click here.

  • Toronto vs. Boston

    I worked late this evening, which is pretty typical these days. After I got home, I flipped on the Raptors vs. Celtics and sat down to write something about cities, as is the case every day.

    But the game was too close and too good to resist. The Raptors turned things around in Q3 and ultimately went on to spank the Celtics with a 10-0 run in the last few minutes of the game. It was sweet, particularly because Toronto and Boston are likely to end up at the top of the eastern conference this season.

    So needless to say, I spent more time watching basketball and less time writing about cities. But that’s okay because I am pretty excited about this year’s Raptors. Here are a few Kawhi Leonard highlights.

  • BIG’s IQON in Quito

    BIG just announced its first project in South America. It is a 33 storey residential building in Quito, Ecuador. When completed, it will be the tallest building in the city. The developer is Uribe and Schwarzkopf

    Here are a couple of other images:

    The building is made up of “concrete boxes” that, when rotated, create terraces for the apartments. On one corner of the building the apartments are “through-units”, meaning they have two exposures. In this case, it is north and south.

    While different, we are starting to see some similarities across BIG’s projects, which isn’t meant as a criticism. I am thinking of Telus Sky, Vancouver House, and even KING Toronto. 

    They are, at least partially, about expressing the individual apartments and creating opportunities for outdoor spaces. This also serves to break down the overall scale of the building.

    What do you think of the project?

    Images: BIG

  • First-year building project

    Each year, first-year graduate students at the Yale School of Architecture are tasked with designing and then physically building a new single-family house in an economically depressed neighborhood. Sometimes, like this year, the house may have multiple dwelling units.

    I have always thought that this is a great exercise both from a pedagogical standpoint and from a positive impact standpoint. Young architecture students get to experience designing and building something from scratch, and lower-income families get a new house. I toured one of the completed houses in New Haven back in, I think, 2005. 

    This building project, which was started in 1967, is fairly unique among architecture schools, though others have replicated the model. When I was living in the US, I spent a few weekends working on homes for Rebuilding Together Philadelphia. But the scope was fairly limited. It was nothing like this.

    I think more schools should do this. And I also wonder if there aren’t permutations of this model that could live outside of the university context.

    Image: Yale

  • Average age of a first-time mother

    image

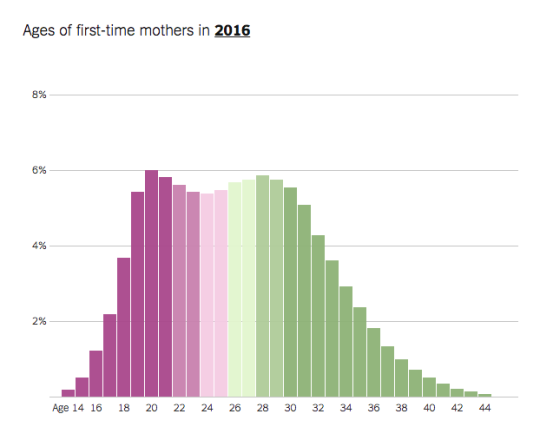
    According to a recent study in the New York Times, the average age of a first-time mother in Manhattan is 31.1 years old. In San Francisco County, the number is nearly 32. And in the US as a whole, it was 26.3 in 2016.

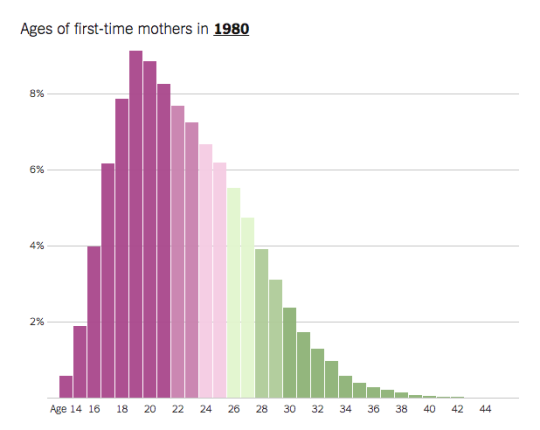
    This is what the national distribution looked like in 1980:

    image

    And this is what it looked like in 2016:

    image

    Perhaps not surprisingly, the biggest factor influencing the age of a first-time mother is education. Becoming educated and building a career takes time. First-time mothers tend to be older in big cities (particularly on the coasts) compared to rural areas.

    The concern that researchers have with all of this is that it is symptomatic of growing inequality. Scrolling over the NY Times’ map, it would appear that there’s nearly a 10 year gap between the coasts and many parts of the country.

    On the one hand you have people who are finishing high school and having kids fairly soon after. And on the other hand, you have people going to college, establishing their career, and waiting, in some cases a decade, to have kids.

    This is significant because it can create a virtuous circle (excerpt from article):

    “A college degree is increasingly essential to earning a middle-class wage, and older parents have more years to earn money to invest in violin lessons, math tutoring and college savings accounts — all of which can set children on very different paths.”

    Unequal childhoods can lead to unequal outcomes.

    Images: New York Times

  • Japan’s solution to housing affordability

    image

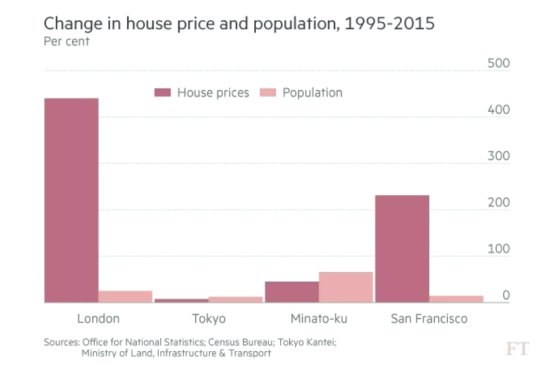
    There’s a debate among urbanists as to the full impact of housing supply on overall affordability. But it should make intuitive sense that as new people move to a city and as new jobs are created, there will be a need for additional housing. Here is an excerpt from Vox citing a recent FT article talking about how Japan may have figured out the solution to rising home prices:

    The reason, argues Financial Times writer Robin Harding, is that Tokyo does a better job of allowing housing supply to keep up with housing demand. In 2014, Tokyo issued permits for 142,417 new housing units. In contrast, the entire state of California — which has three times the population of Tokyo — issued permits for only 83,657 new housing units. Little wonder that demand for housing has outstripped supply in the Bay Area.

    In the United States, local housing markets are plagued by grassroots “Not In My Back Yard” (NIMBY) activists who organize to stop efforts to build town homes and apartment buildings in their local neighborhoods. Because every construction project is located near somebody, the result tends to be that little housing gets built anywhere.

    I don’t have a copy of the FT article and I do firmly believe that supply matters a great deal, but I think there are also a number of other factors that need to be taken into consideration here. Japan has a depopulation problem. The country has lost about 1.4 million people since 2010

    They also have fairly insular views around immigration. They are over 3.5x larger than Canada in terms of population and yet they take in fewer immigrants each year. So I think it’s worth looking at this conclusion closely. (This is me trying to avoid confirmation bias.)

    Image: Vox

  • In support of narrative memos

    This is not new. It has been reported on before. But I just finished reading this article about Jeff Bezos’ relentless commitment to “high-quality and high-velocity decision making” at Amazon.

    Here are a couple of high level points:

    – There are decisions that cannot be easily reversed (Type 1) and there are decisions that can be (Type 2). Knowing which is which is important. To help get better at this, they are very diligent about tracking the outcomes of previous decisions.

    – Make decisions without all of the info you wish you had, because if you don’t, you’re probably moving too slow. Speed is paramount. If you’ve categorized your decisions properly (see above), being wrong may not actually be that costly.

    – There’s a company philosophy centered around “disagree and commit.” It is about moving forward – since speed is so important – without full consensus. In other words: We may not all agree, but can we disagree and commit to this?

    Perhaps the most interesting, and seemingly paradoxical, aspect of Amazon’s “high-velocity decision making process” is that it is built upon narrative memos, instead of PowerPoint decks. In fact, decks have been banned at the company since 2004.

    The reason for this is that narrative memos are more difficult to write, which means you really have to understand what you’re talking about. It encourages deeper thought and it allows nuances and interdependencies to come through.

    Apparently important meetings start with everyone just sitting in a room reading the narrative memo, which are often between 4-6 pages. Once everyone has read the memo and is on the same page, the meeting starts.

    As someone who writes a daily narrative, this approach really resonates me. It would be a hell of a lot easier if I could just show up here every day and throw down a few bullet points. But then both of us would get far less out of this practice.

    Writing takes time. Bezos has acknowledged that these memos cannot be written in a day or two. But clearly there’s a belief that more time spent up front translates into greater overall speed. Their market cap suggests that is working.

  • The world’s best brands — 2018 edition

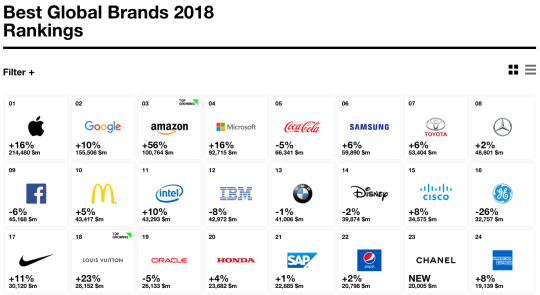
    At the beginning of this month, Interbrand released its annual ranking of the world’s best global brands. This year’s 2018 report marks the 19th year of the study. If you’d like to download a free copy of the report, you can do that here. But below is a snapshot of the first 24 brands:

    Apple and Google are in top position for the 6th year in a row. And Amazon is on a hockey stick trajectory with its brand value jumping by 56%. More than half of the list is comprised of the following five sectors: Automotive (16), Technology (13), Financial Services (12), Luxury (9), and Fast-Moving Consumer Goods (9). Luxury is currently the fastest growing sector.

    In their report, they outline five themes that have emerged and that are helping these brands outperform. They are:

    1. Positive utility – not enough to just make people feel good through storytelling; you need to create real value and a positive impact in the world
    2. Subscription mindset – there’s an increasing amount of brand value in subscription-based businesses (29% in 2018 compared to 18% in 2009); you need to offer your products and services with the least amount of friction as possible
    3. Customer-centricity – bring the voice of your customer into every aspect of your business; be nimble enough to respond quickly
    4. Learning from luxury – the top performing category in this year’s ranking; about exclusivity and authenticity
    5. Role of brand – make your brand part of the decision-making process; build brand equity and trust

    I’ll stop there and let you all dig into the rest of the report if you’re interested. 

    But one thing I found particularly interesting about the study is that they used – insert buzzwords here – “AI-powered social listening” to try and measure the emotion and sentiment floating around on the internet around specific brands. The goal was to pin down the perceived trustworthiness of specific brands.

    Not surprisingly, they found a pretty strong correlation between customer trust and purchasing intent. Makes sense to me.

  • Cities are always changing. What’s happening in Miami Beach?

    image

    The Miami Herald has a recent article up asking: Has Miami Beach lost its mojo? While the beach will always be an immense draw, there’s concern that entertainment dollars could now be starting to favor mainland neighborhoods like Wynwood, Brickell, and the Design District. 

    Here are some of the reasons why it is believed that may be happening:

    – Structural changes to the retail landscape

    – High rents have pushed out all of the interesting and distinctive tenants

    – City is too lenient when it comes to the nighttime economy; South Beach has become a circus

    – Investors and developers are worried about the Beach’s exposure to sea level rise

    – Strips like Ocean Drive and Lincoln Road have simply completed their urban cycle and are no longer attractive and novel

    – Overdevelopment of luxury housing (curiously, there’s a preservationist quoted in the article who appears to believe that restricting development to only mid-rise will result in less luxury housing)

    Many of these points are certainly not unique to Miami Beach. We know the retail landscape is changing. But as I was reading through the article, I was once again reminded that cities are always changing – even when we try and stop them from doing that.

    There are over 900 historic buildings in the Miami Art Deco District. Most are low-rise and mid-rise. This includes the iconic Ocean Drive. And yet the above article is all about the changes that the Beach has seen and experienced over the years.

    Oftentimes we only associate change with new buildings. But architectural preservation does not guarantee any sort of urban stasis. Cities are far more complex than that.

    Image: Photo by Ryan Spencer on Unsplash