Daily insights for city builders, delivered every morning at 6 AM ET. I’m Brandon Donnelly — a Toronto-based real estate developer and founder of Globizen. I’ve been writing here since 2013.

Author: Brandon Donnelly

  • Non-load-bearing curtain wall

    image

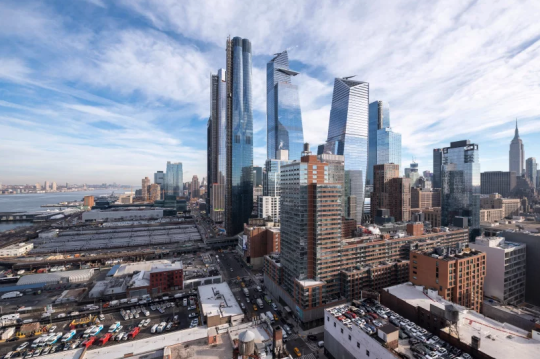
    Liz Diller of Diller Scofidio + Renfro was recently asked by designboom about how her firm approached the design of Fifteen Hudson Yards (the first residential tower in New York’s Hudson Yards).

    The firm had never designed a high-rise before. So while their typical approach would be to analyze program, here they were heavily informed by the views – both in and out from the site – as you move up the tower.

    The 88 storey tower transitions between two footprints. The base matches the street grid of the city, but as you move up the tower it transforms into a cloverleaf – allowing panoramic views of the city.

    It is a somewhat similar approach to what has been proposed by Studio Gang for One Delisle. Except for the transformation here is to a multifaceted cylindrical shape (a hexadecagon is what has been drawn).

    From the late 19th century when Chicago began to pioneer the modern skyscraper, architects and engineers have been thinking about how you treat a tall building as you move from top to bottom.

    Chicago architect Louis Sullivan responded to this challenge with his tripartite approach to design. He believed that tall buildings should be characterized by three main divisions: a base (bottom), a shaft (middle), and a cap (top).

    The technological innovation that allowed this thinking to flourish was the non-load-bearing curtain wall. Once the exterior walls of a tower no longer supported the actual building, architects then had the freedom to really experiment.

    This remains true to this day, but we no longer need to confine ourselves to only three parts. New technologies now allow for more.

    Today we have parametric modeling and other design tools that allow us to create new geometries and transitions; forms that would have been pretty complex to draw up in the past. 

    In the case of Fifteen Hudson Yards, every floor plate from 20 something and up is slightly different. I wonder what Louis would think of this.

    Image: Timothy Schenck via designboom
  • A mapping of development potential in Toronto

    I first met Monika Jaroszonek in 2017, right before she started RATIO.CITY. Since then she has developed some pretty incredible tools for the city building space.

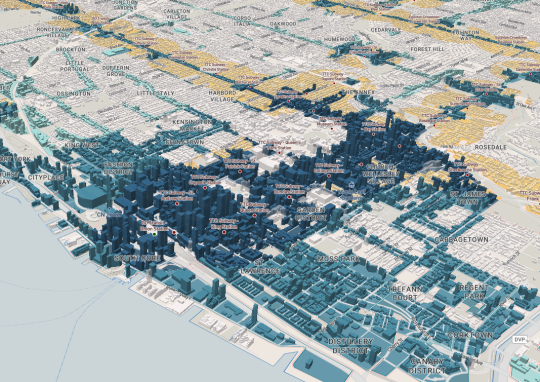
    Yesterday the company published this interactive visualization looking at development potential across the City of Toronto. The mapping looks for the following:

    The tool then ranks each development site – AAA, AA, A – according to how many of the above criteria it meets.

    It also flags land that it refers to as “Missed Opportunity.” These are lands located within 500m of a Major Transit Station, but that are designated as Neighbourhoods (considered stable) or Employment (whole other discussion).

    Based on this filter, about 5.6% of the City’s land is a “Missed Opportunity” and about 1.2% is AAA.

    When you look at the visualization, that is one of the first things you will probably notice; a lot of our transit infrastructure is currently underutilized as a result of land use policies.

    Image: RATIO.CITY

  • Unusual ski-spots around the world

    “Like so many sports that humans do,” he [Kari Medig] says, “skiing can seem absurd: sliding over the miracle of frozen water, slipping down steep mountains wearing layers of crazy clothes—it really is a strange thing to do.”

    I love skiing (well snowboarding to be exact). And I love photography. So here is an interesting photo essay from FvF about “the unexpected diversity of the ski community.” It features the work of Canadian photographer Kari Medig.

    Kari’s career is centered around photographing unusual ski-spots around the world. He has discovered that every locale has its own unique subculture. In some places, skiing is about status. But in other places, people depend on it for their livelihood.

    Eventually Kari hopes to turn this lifelong ski project into a book. I sure hope he does that. I bet it would do very well on Kickstarter. (On a largely unrelated note, his photos of Rio de Janeiro are at least 100x better than mine.)

    Image: Kari Medig

  • Laneway house on the market for $2,845,000

    I was looking at this laneway house for sale in Toronto today. It’s located near Queen and Bathurst. It has 3 bedrooms and 3 bathrooms and is about 2,331 square feet (that looks to include a basement). The lot appears to be just over 13′ wide. And the asking price is $2,845,000.

    Single family homes aren’t typically considered on a per square foot basis, but if you do the math here, it works out to be around $1,220 psf. The property previously sold in 2017 for $805,000, which was prior to it being redeveloped. So it likely traded based on land value.

    When Toronto first started considering modern laneway houses, some people thought that only individuals of questionable moral fiber would want to live in one. But today, there are countless examples of some pretty remarkable laneway houses. 

    And in some cases you might need about $3 million or so.

  • Tallest buildings completed in 2018

    image

    The Council on Tall Buildings and Urban Habitat (CTBUH) recently published their annual study looking at all of the 200+ meter tall buildings completed over the last year.

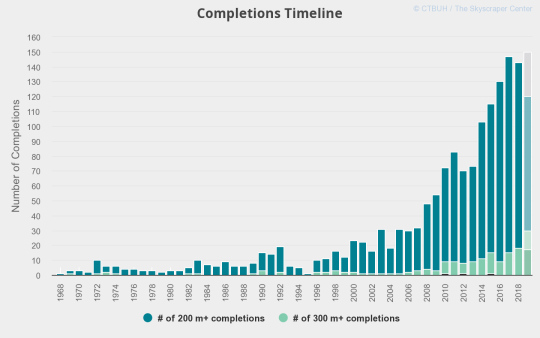
    143 were completed around the world. The all-time record was 147, which was in 2017. Last year, 18 “supertalls” were also completed. A supertall building is generally defined as having a height of 300m or more.

    The tallest building completed in 2018 was China Zun in Beijing. Pictured above. It is 527.7m tall (to tip), but the occupied height is 513.5m. 

    It was designed by Kohn Pedersen Fox Associates and looks like a Chinese finger trap. All iconic buildings deserve an endearing nickname, right?

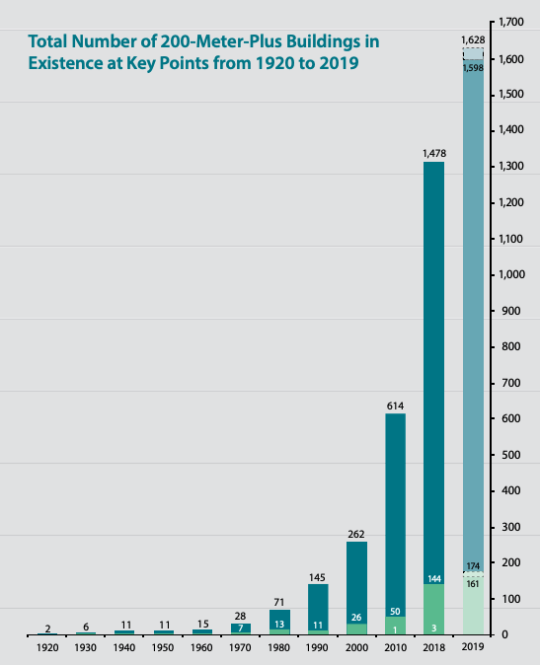
    Below are a few interesting charts from the report. The first is the total number of tall buildings over 200m from 1920 to 2019. At whatever point they chose in the 1920s, there were only 2. Things sure changed starting in the 1980s.

    image

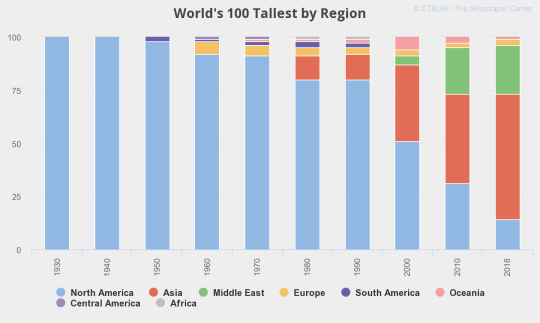
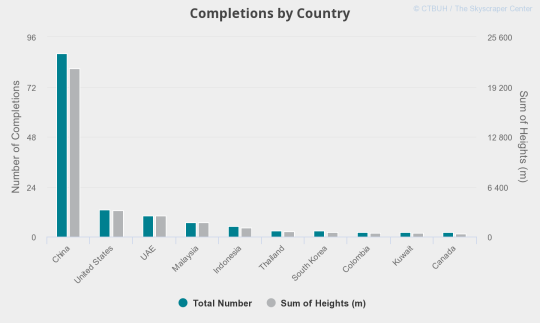
    That exponential growth happens to coincide with tall building growth in Asia and in particular China. The next few charts show (1) the handover from North America to Asia; (2) completions per year (broken down by talls and supertalls); and (3) completions by China, I mean country, last year.

    imageimageimage

    The full 2018 year in review report can be found here.

    Image: CTBUH

  • Real estate startup Knock raises $400 million

    I have been writing about the real estate startup Opendoor for many years here on the blog. Another promising startup in this space is Knock, and today it was announced that they just raised a $400 million Series B round (led by Foundry Group).

    They share some similarities with Opendoor, but they are also different in that their focus is on home trade-ins. They tell you what your current home is worth, help you find a new home, and then coordinate “a seamless swap.” For more on how they work, go here.

    One of the ways in which they are similar to Opendoor is that they front the cash for new home purchases. In the case of Opendoor, they buy your home with the plan of selling it in the future. And with Knock, they buy your home with the understanding that your old home will get sold.

    It is certainly a more capital intensive model compared to the way that home sales are handled today. But many investors are clearly betting that it is exactly what is needed to change the status quo. 

    (Credit to Jeremiah Shamess for sharing the above news with me today.)

  • Are you happy with where you live?

    This past weekend I saw a few people reacting on Twitter to this article by Wendell Cox talking about how Canadian families are being denied their preferred housing choice: the detached single family home.

    The fact that the article is by Wendell Cox should tell you everything you need to know. But essentially the argument is that misguided planning policies are driving up the cost of housing and that we should, instead, be encouraging unfettered sprawl.

    There’s lots to discuss here, but the first thought that actually came to mind was: “How would this article sound if we replaced all of the references to housing with references to cars?” In case you too are wondering that, this is how the first paragraph would read:

    A new poll by Sotheby’s International Realty suggests substantial disappointment among Canada’s young urban families, unable to afford to purchase the types of [cars] that they prefer. The poll determined that young urban households in Canada strongly prefer [Aston Martins], but they are often “motivated by (financial) necessity to purchases [sic] [cars], especially [BMWs], they do not prefer.“

    The article is clearly one-sided. I don’t disagree that there are people who – all things being equal – would prefer to raise a family in a ground-related single family home. Backyards serve a purpose, as do large basements equipped with beer fridges.

    But all things are not equal. And there also people who value walkability, a reasonable commute, and the kind of urban amenities that come along with being in a dense city. I am one of those people.

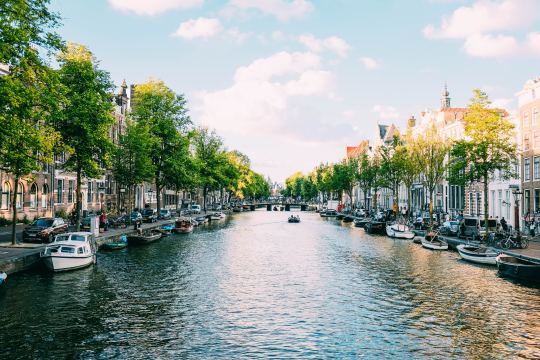
    Photo by Adrien Olichon on Unsplash

  • The disappearing urban advantage

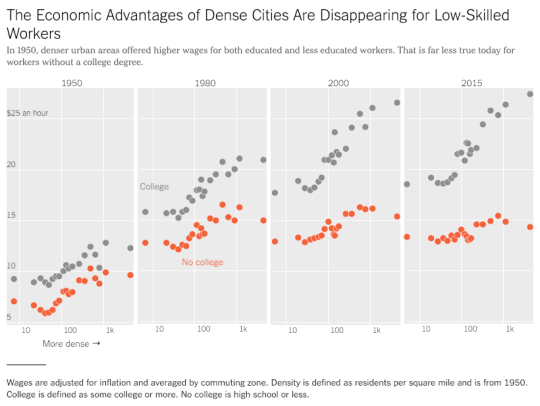
    The New York Times has a recent article up talking about the disappearing “urban advantage” for low-skilled workers. It is based on the work of MIT economist David Autor.

    Here is a chart from the article plotting wages against population density from 1950 to 2015:

    image

    The clear takeaway is that dense urban centers remain a place where wealth is created – but you probably need a college degree.

    The economic advantages of dense cities for those without one appears to be disappearing. The labor market has diverged.

    Interestingly enough, David’s research also suggests that college graduates may be starting to abstain from the suburbs – even when they have kids.

    And that’s because the returns to being in the city are so great.

    For the full NY Times article, click here

  • Dendrochronology of U.S. immigration

    I can’t remember where I found it, but I recently stumbled upon this video simulating the dendrochronology of U.S. immigration from 1830 to 2015. 

    It is part of an ongoing project by Pedro Cruz, John Wihbey, Avni Ghael, and Felipe Shibuya, and is supported by Northeastern University.

    As its name suggests, the video (and broader study) uses the metaphor of a tree (and its growth rings) to explain historical immigration to the U.S. 

    If you can’t see the video below, click here.

    [vimeo 276140430 w=640 h=280]

  • The geography of gyms

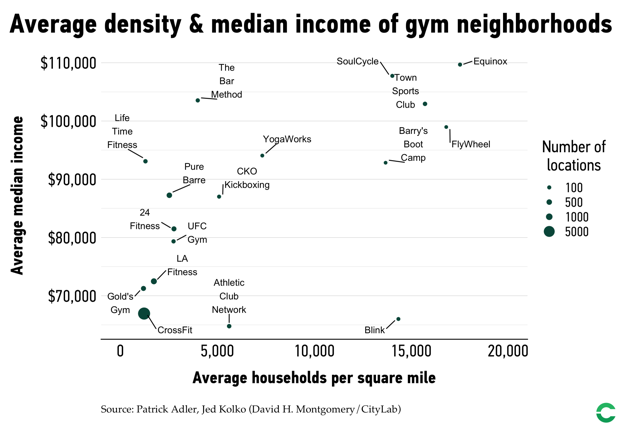
    Richard Florida and Patrick Adler recently looked at the geography of gyms across the United States. They analyzed 17 different fitness chains, over 10,000 gyms, and nearly 5,000 zip codes. Full article over here at CityLab.

    image

    The findings probably won’t surprise you, but it’s still interesting to see some of the data. Gyms and fitness studios tend to concentrate themselves in affluent neighborhoods with a high number of college graduates.

    The median household income of the average zip code with a gym or fitness studio is $72,720. This is compared to $56,694 for all zip codes. And when it comes to zip codes with an Equinox, SoulCycle, The Bar Method, or Town Sports Clubs, the median income jumps to over $100,000.

    Above is from the second post in the two part series they are doing on “the geography of fitness.” For the first one, click here.